US advertisers increased spending in 2014 by 0.7%, offering hope for 2015
March 19, 2015
![]() Total advertising expenditures increased 0.7 percent in 2014 and finished the year at $141.2 billion, according to data released by Kantar Media, the leading provider of strategic advertising and marketing information. Ad spending during the fourth quarter of 2014 decreased 1.6 percent versus the year ago period.
Total advertising expenditures increased 0.7 percent in 2014 and finished the year at $141.2 billion, according to data released by Kantar Media, the leading provider of strategic advertising and marketing information. Ad spending during the fourth quarter of 2014 decreased 1.6 percent versus the year ago period.
“Advertising growth in 2014 was primarily stimulated by the triple play of Winter Olympics, World Cup and midterm elections,” said Jon Swallen, Chief Research Officer at Kantar Media North America. “Although total spending volume slowed in Q4, a majority of the Top 1000 advertisers actually increased their year-over-year spending during the period, a promising sign for the start of 2015.”
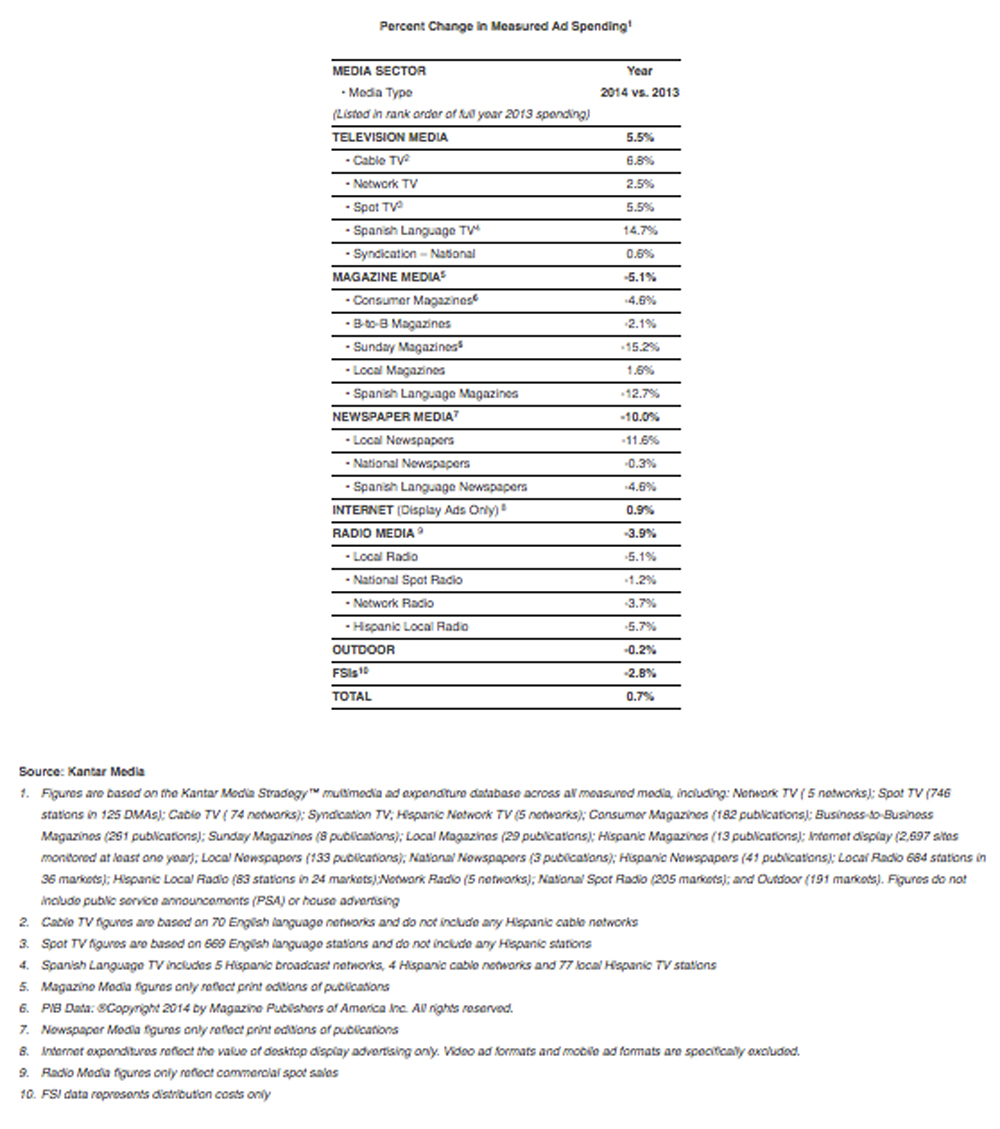
Measured Ad Spending By Media – Cable, Internet Display Grow
In 2014, the Television sector received its biennial boost from the Olympics and political elections, and also benefitted from higher ad expenditures on sports programming.
Cable TV expenditures rose 6.8 percent in 2014 and were led by healthy spending growth from the motion picture, pharmaceutical, restaurant and telecom categories. Cable was also helped by a 1.7 percent increase in the amount of paid ad time. Since 2010, the average cable network has raised its commercial load by twelve percent.
Full-year Network TV expenditures increased 2.5 percent, with about four-fifths of this growth coming from the Winter Olympics. Spot TV spending rose 5.5 percent in 2014, boosted by a torrent of political money. Spanish language TV ad expenditures were up 14.7 percent versus the prior year, paced by the midyear World Cup event. Syndication expenditures increased 0.6 percent.
Measured spending for online display, which currently does not include video or mobile ad formats, eased in the second half of 2014 and finished the full year 0.9 percent higher. Increased investments from the local services, media and retail categories were offset by sharp declines among telecom, dot-com and travel advertisers.
Outdoor posted a 0.2 percent decrease in ad expenditures for 2014, but was buoyed by the continuing expansion of digital signage, which gives advertisers more flexibility when purchasing space and allows operators to earn a higher price. Over the past four years, digital outdoor spending has grown six times faster than the overall medium.
All forms of Radio media had lower spending in 2014. Local Radio fell 5.1 percent and National Spot Radio declined 1.2 percent. Each was affected by steep reductions from the financial service, restaurant and travel categories. Network Radio expenditures dropped 3.7 percent
Print media experienced continuing losses during 2014. Expenditures in Consumer Magazines as calculated by rate card prices fell 5.1 percent. Publishers experienced broad cutbacks from automotive, consumer package goods, financial service and travel advertisers. Higher spending from the apparel and pharmaceutical categories was a bright spot. Sunday Magazines declined 15.2 percent on a combination of fewer issues published, fewer advertisers using the medium and cutbacks by continuing advertisers. Local Newspaper ad spending fell 11.6 percent. The decline was even more precipitous among the twenty largest newspaper advertisers, which slashed their aggregate spending more than 20 percent. (Note all these figures are based on print channels only and do not include activity on websites or other properties operated by print brands).
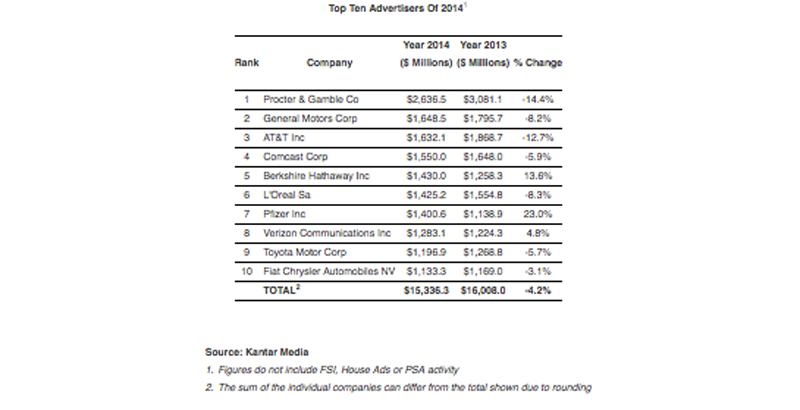
Measured Ad Spending By Advertiser – P&G Still On Top
Spending among the ten largest advertisers in 2014 reached $15,336.3 million, a 4.2 percent decrease compared to a year ago. Among the Top 100 marketers, a diversified group representing more than two-fifths of all measured ad expenditures, spending was 2.4 percent lower.
Procter & Gamble was the top advertiser with $2,636.5 million spent, down 14.4 percent compared to 2013. P&G has posted four consecutive quarters of year-over-year expenditure declines. The cutbacks have occurred in all major media but are most pronounced in magazines and internet display.
Three auto manufacturers landed in the Top Ten and each reduced its ad spending in 2014. General Motors ad expenditures were down 8.2 percent to $1,648.5 million; Toyota Motor spending dropped 5.7 percent to $1,196.9 million; and Fiat Chrysler fell 3.1 percent to $1,133.3 million. Each company had a relatively lighter schedule of marketing launches in 2014 and this hurt comparisons against 2013.
Among telecom companies, AT&T spending declined 12.7 percent to $1,632.1 million while Verizon Communication raised its investments 4.8 percent to $1,283.1 million.
Pfizer had the largest growth rate among the Top Ten marketers, up 23.0 percent to $1,400.6 million. The company has raised its year-over-year spending for seven consecutive quarters, principally for top-selling Rx brands, which are under patent protection and don’t face competition from generic alternatives. Berkshire Hathaway increased its spending 13.6 percent to $1,430.0 million, primarily in support of the GEICO brand.
Measured Spending By Size of Advertiser: Mid-Size Marketers Lead the Way
The Top Ten advertisers account for only about one-tenth of all spending and are rarely a bellwether of broader trends. Ranking and grouping companies into tiers provides deeper insights about how different segments are behaving compared to the average and helps identify where growth is occurring.
Kantar Media splits parent companies into three groups based on full year ad spend. Large advertisers are defined as the Top 100 marketers and currently have a 43 percent share of total spending. The mid-size segment (ranks of 101-1000) is 34 percent of spending. Small advertisers (ranks of 1001+) have a 23 percent share.
In 2014, the mid-sized cohort reaffirmed its continuing dominance as the fastest growing segment, posting a 4.6 percent increase in ad spend. This tier has now led the market for four consecutive years.
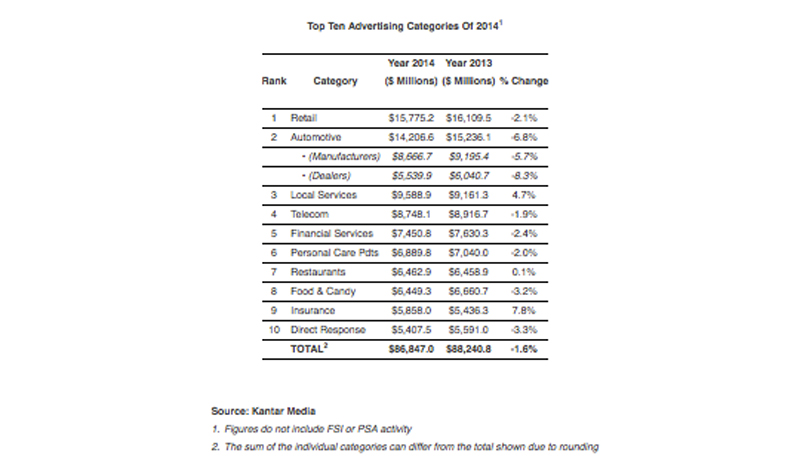
Measured Ad Spending By Category – Big Increase For Insurance
Expenditures for the ten largest advertising categories declined 1.6 percent in 2014 to $86,847.0 million Retail was the leading category in dollar volume but fell 2.1 percent to $15,775.2 million. A broad slowdown in spending throughout the second half of the year pushed the category into negative territory.
Automotive was the second largest category with $14,206.6 million of spending, down 6.8 percent from the prior year. Manufacturer expenditures fell 5.7 percent and auto dealers spent 8.3 percent less. Auto spending lagged in 2014 because there have been fewer big-scale marketing launches versus a year ago.
Insurance finished the year with expenditures of $5,858.0 million, a 7.8 percent increase that was best among the Top Ten categories. Heated competition for market share among auto underwriters continues to drive their media budgets higher. The Affordable Care Act was a stimulus for increased ad spending by health insurers.
Expenditures in the Local Services category rose 4.7 percent to $9,588.9 million. Growth was spurred by local service providers connected to the health care and housing markets.
Reduced spending by consumer packaged goods brands was reflected in results for Personal Care Products (down 2.0 percent to $6,899.8 million) and Food & Candy (down 3.2 percent to $6,449.3 million).