U.S. Advertising Expenditures Increased 0.7% in Q2 2014
September 17, 2014
![]() Total advertising expenditures increased 0.7 percent in the second quarter of 2014 to $35.6 billion, according to data released today by Kantar Media, the leading provider of strategic advertising and marketing information. During the first six months of 2014 ad spending grew 3.1 percent.
Total advertising expenditures increased 0.7 percent in the second quarter of 2014 to $35.6 billion, according to data released today by Kantar Media, the leading provider of strategic advertising and marketing information. During the first six months of 2014 ad spending grew 3.1 percent.
“The slow growth rate of ad spending in Q2 is payback for the surfeit of money in Q1 that was pulled forward to fund Olympics budgets,” said Jon Swallen, Chief Research Officer at Kantar Media North America. “Our analysis shows that Olympics advertisers reduced their year-over-year Q2 spending by more than 4 percent while non-Olympics advertisers posted a 2 percent increase. The latter is more indicative of core ad market performance at the midyear point.”
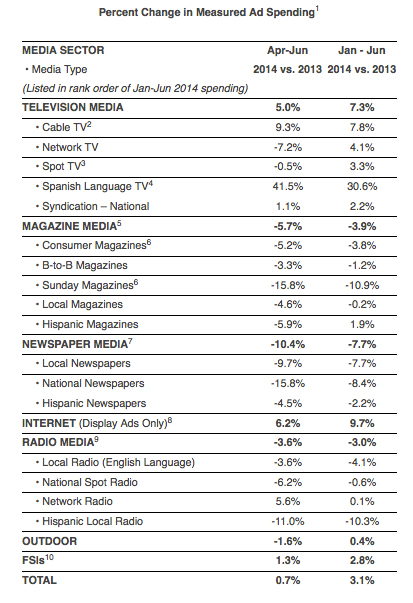
Measured Ad Spending By Media
Total expenditures in Television media increased 5.0 percent in the second quarter of 2014 but there was wide variance within the sector, as three major sporting events had a significant impact. Spanish Language TV spending was up sharply by 41.5 percent, with a big assist from the first three weeks of the World Cup tournament at the end of June. Cable TV expenditures rose 9.3 percent compared to a year ago. About one-third of the gain was attributable to the World Cup and semi-finals games of the NCAA Men’s Basketball Tournament, which aired on cable for the first time. Meanwhile, Network TV spending dropped 7.2 percent in Q2 and was affected by having fewer March Madness and NBA playoff games compared to last year. Spot TV expenditures declined 0.5 percent as higher political spending was offset by reductions among automotive and telecom advertisers.
Internet display spending grew 6.2 percent in the second quarter as financial, retail and local service marketers raised their budgets. FSI was the only other media type to post a gain in the second quarter, up 1.3 percent.
Print media continued to contract in Q2. Local Newspaper advertising fell 9.7 percent and National Newspapers declined 15.8 percent. Each saw lower spending from the automotive, financial service and retail categories. Consumer Magazine expenditures were down 5.2 percent in the period. Although a majority of the 100 largest magazine advertisers increased spending, these gains were not enough to overcome losses due to fewer brands using the medium. Ad expenditures in Sunday Magazines fell 15.8 percent as pharmaceutical and consumer package goods pulled back. (Note that these trends are based on print channels only, and do not include advertising on websites or other properties maintained by print brands.)
Results for Radio media were mixed. National Spot Radio declined 6.2 and Local Radio, which reflects English language stations, was down 3.6 percent. Both segments were hit by sharply lower spending from the financial service, insurance and restaurant categories which outweighed small gains from telecom and retail advertisers. Network Radio expenditures rose 5.6 percent on higher spending from a broad range of key categories.
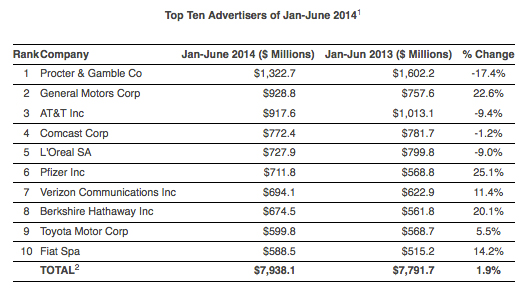
Measured Ad Spending By Advertiser
For the first six months of 2014, spending by the ten largest advertisers was $7,938.1 million, a 1.9 percent increase compared to a year ago. Among the Top 100 marketers, a diversified group accounting for almost 45 percent of the ad market, investments were up 2.9 percent.
Procter & Gamble easily held onto its position as the largest advertiser, even though it lowered spending by 17.4 percent to $1,322.7 million. After a small decline in Q1, P&G slashed expenditures by almost one-third during Q2. The latter comparison is against an atypically high volume of year-ago spending. Q2 is also the end of P&G’s fiscal year and ad budgets may have been sacrificed to improve the balance sheet and meet financial targets.
Three automakers are represented in the top-ten rankings and for each their half-year totals were characterized by sharply higher spending in Q1 (due to new product launches as well as investments in Q1 sporting events) followed by significant declines in Q2, leaving them with net gains. General Motors spent $928.8 million, an increase of 22.6 percent. The company continues to shift its advertising allocation from passenger cars towards SUVs and pickup trucks in response to market sales trends and the opportunity to earn bigger profits. Toyota Motor raised its ad expenditures 5.5 percent to $599.8 million and Fiat Spa lifted spending 14.2 percent to $588.5 million. For both manufacturers the increases were connected to marketing launches of redesigned models.
Pfizer had the largest growth rate among the top ten advertisers with a 25.1 percent increase to $711.8 million. The company has been putting more marketing resources behind top-selling Rx brands that are still under patent protection and don’t yet face competition from cheaper generic alternatives.
Berkshire Hathaway raised its spending 20.1 percent to $674.5 million in the first half of 2014, primarily in support of the GEICO insurance brand.
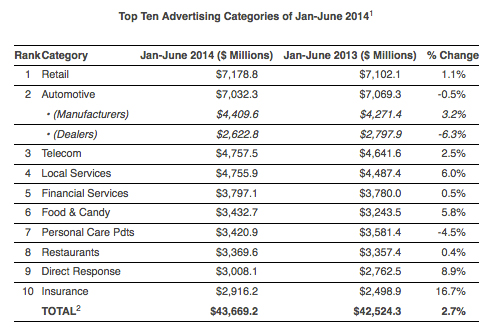
Measured Ad Spending By Category
Expenditures for the ten largest advertising categories grew 2.7 percent to $43,669.2 million in the first six months of 2014. Eight of the ten had spending increases.
Retail was the top category with expenditures of $7,178.8 million, a 1.1 percent increase. Larger investments from apparel, home furnishing and sporting goods retailers provided a boost but were offset by continuing reductions among major department store brands.
Automotive was the second largest category in the January-June period with expenditures of $7,032.3 million, a decrease of -0.5 percent. After vigorous growth in Q1 that was aided by the Winter Olympics, spending declines were the norm in Q2 for many leading auto nameplates.
The largest growth rate among the top ten categories in the first half of 2014 came from the Insurance sector where spending rose 16.7 percent to $2,916.2 million. Auto insurers remained fiercely competitive throughout the period and there was also an advertising surge for health care coverage that extended beyond the March 31st enrollment deadline for Obamacare.
Spending on Local Services increased 6.0 percent to $4,755.9 million. Within the category, the top-performing segment was service businesses connected to home ownership and the housing industry. Legal Services also posted higher expenditures.
Food & Candy expenditures finished the half year period at $3,432.7 million, up 5.8 percent versus a year ago. The gain was concentrated among a few candy and gum advertisers who boosted their total spending in support of new product introductions.
Telecom advertising increased 2.5 percent to $4,757.5 million during the first six months of the year but it was a deceptive result which masked spreading weakness. In a category where total dollars were up $135 million, a single marketer (Dish TV) hiked its budgets by $206 million as it navigates a marketplace being reshaped by mergers among its largest rivals. Without Dish’s incremental contribution, the telecom category would have had a net decline and the spotlight would have shone on an emerging deceleration of spending by the major wireless providers.