Last Census Population Estimates of the Decade Preview 2020 Census Count – [GROWTH SLOW]
April 7, 2020
 The nation’s growth continues to slow, according to Vintage 2019 population estimates by the U.S. Census Bureau – the last estimates before results of the 2020 Census count of the U.S. population are released at the end of the year.
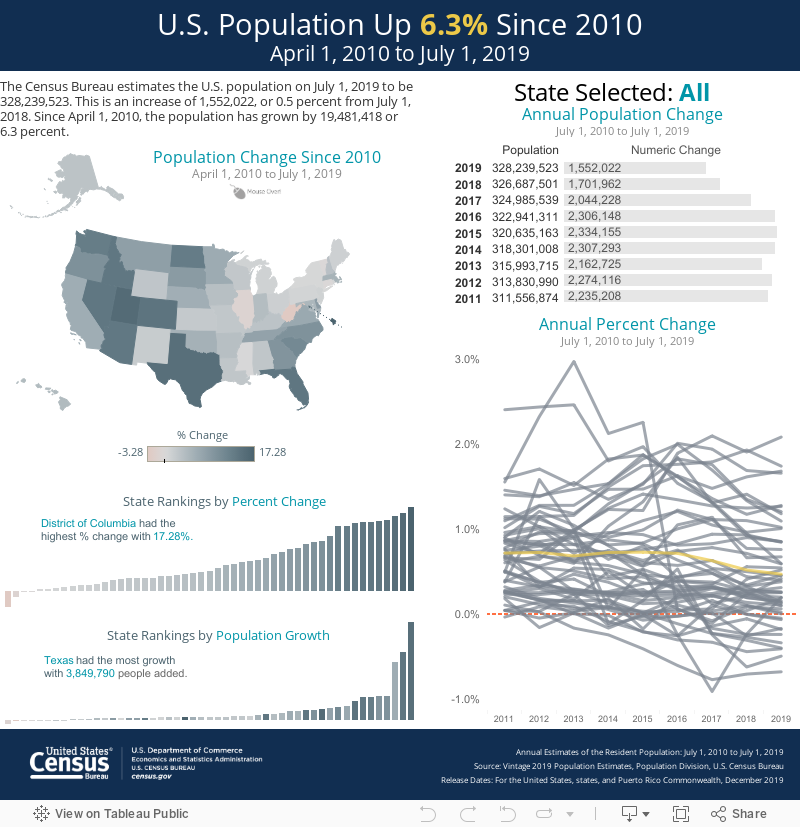
The U.S. population was at 328.2 million on July 1, 2019, up 0.48% since July 1, 2018. Growth has slowed every year since 2015, when the population increased 0.73% relative to the previous year.
Since the 2010 Census, the population has increased by 19.5 million or 6.3%. The average annual growth between July 2010 and July 2019 was 0.66% compared to an average of .97% the previous decade.
The interactive visualization below illustrates changes from April 1, 2010 to July 1, 2019 for the United States, the 50 states and the District of Columbia.
All but four states saw population increases between 2010 and 2019.
The three states with the most growth were Texas (3,849,790), Florida (2,673,173) and California (2,257,704). The District of Columbia had the highest percentage change (17.3%), followed by Utah, Texas and Colorado.
Four states have lost population since the 2010 Census: Vermont (-1,748), Connecticut (-8,860), West Virginia (-60,871) and Illinois (-159,751).
Click on the two bar charts below the map to see how all states compare.
The Census Bureau will soon release estimates of the 2019 population for counties, cities and towns, and metropolitan and micropolitan statistical areas, as well as national, state and county population estimates by age, sex, race and Hispanic origin.
It will also release population estimates by age and sex for Puerto Rico and its municipios. These estimates include counties affected by the 2017 hurricane season.
Vintage 2019 estimates will be the last official series of estimates released prior to the 2020 Census.