U.S. Advertising Expenditures declined in Q3 2013
December 17, 2013
![]() Total advertising expenditures in the third quarter of 2013 declined 1.9 percent from a year ago and finished the period at $34.0 billion, according to data released today by Kantar Media, the leading provider of strategic advertising and marketing information. For the year-to-date period of January through September, total spending increased 0.7 percent to $102.5 billion.
Total advertising expenditures in the third quarter of 2013 declined 1.9 percent from a year ago and finished the period at $34.0 billion, according to data released today by Kantar Media, the leading provider of strategic advertising and marketing information. For the year-to-date period of January through September, total spending increased 0.7 percent to $102.5 billion.
“Comparisons against Q3 of 2012 are skewed by last year’s record-breaking Summer Olympic and political campaign ad spending, which artificially boosted the market,” said Jon Swallen, Chief Research Officer at Kantar Media North America. ““Remove that incremental money from the year-ago base and spending in Q3 2013 was up 2.5 to 3.0 percent. This is more indicative of how the ad market is currently performing.”
Measured Ad Spending By Media
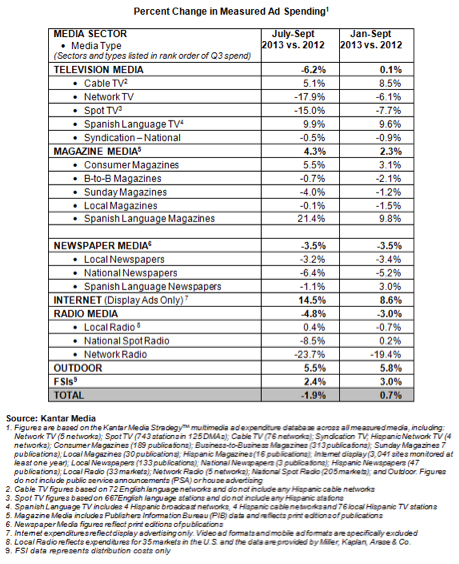
Without the benefit of an Olympics event, Network TV expenditures in the third quarter fell 17.9 percent compared to a year ago. Spot TV dropped 15.0 percent, primarily due to the reduction in political category spending that occurs in odd-numbered years. Other television segments had healthy gains in Q3. Spanish Language TV ad expenditures rose 9.9 percent, principally from more hours of soccer programming on Hispanic networks. Spending on Cable TV networks was up 5.1 percent and continues to be lifted by a creeping expansion of ad time.
Spending for Internet display advertising, which does not include video or mobile ad formats, grew 14.5 percent in the quarter on broad gains from the financial service, telecom and technology categories. Outdoor advertising expenditures rose 5.5 percent, the sixteenth consecutive quarter of year-over-year increases. The medium is benefitting from digital signage, which allows multiple advertisers to share a single space and enables operators to command higher prices.
Magazine media had mixed results in third quarter, depending on the segment. On the positive side, Consumer Magazine expenditures increased 5.5 percent on higher activity from consumer package goods and apparel marketers. Ad pages grew a scant 0.3 percent. On the down side, spending in Sunday Magazines declined 4.0 percent but this is explained by a calendar quirk: there were thirteen Sundays in Q3 2013 as compared to fourteen the prior year. Meanwhile, B-to-B Magazines (-0.7 percent) and Local Magazines (-0.1 percent) each fell by a small amount.
Radio media also experienced mixed results for the quarter. Local Radio, despite the headwinds from lower political ad spending, eked out only a 0.4 percent gain in total expenditures. Spending on National Spot Radio fell 8.5 percent on cutbacks by restaurant, retail and financial service advertisers. Network Radio expenditures plunged 23.7 percent but the decline was exaggerated by a reduction in radio programming tracked by Kantar Media.
The persistent and steady contraction of Newspaper media continued in Q3 of 2013. Expenditures in Local Newspapers dropped 3.2 percent and National Newspapers were down 6.4 percent on commensurate declines in the volume of ad space sold, indicating weak demand. For both segments the spending reductions were led by the automotive, retail and financial service categories.
Measured Ad Spending By Advertiser
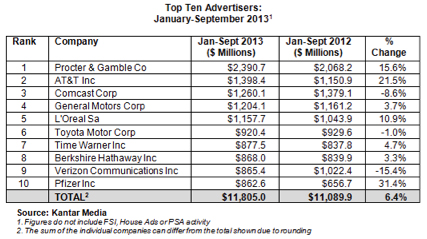
Spending among the ten largest advertisers for the first nine months of 2013 was $11,805.0 million, a 6.4 percent increase compared to a year ago. Among the Top 100 marketers, a diversified group accounting for more than two-fifths of all measured ad expenditures, budgets rose 3.3 percent.
Procter & Gamble was the top-ranked advertiser in the January-September period, with measured expenditures of $2,390.7 million, an increase of 15.6 percent. The spending hikes were broadly distributed across its brand portfolio.
AT&T was the second largest advertiser, lifting its year-to-date ad budgets by 21.5 percent to $1,398.4 million. In addition to higher spending on wireless services, AT&T nearly doubled its marketing support for the U-Verse brand and this accounted for a majority of the overall increase. Rival Verizon Communications reduced its total expenditures by 15.4 percent, to $865.4 million. The spending gap between the two telecom giants is now at its widest margin in a decade.
Pfizer posted the largest growth rate among the Top Ten, with spending up 31.4 percent to $862.6 million. The company undertook expensive marketing launches for two new prescription medications while also boosting ad support for many existing Rx brands.
Two automakers are on the Top Ten list. General Motors had expenditures of $1,204.1 million, up 3.7 percent versus a year ago. The company has recently been shifting budgets towards pickup truck models, most notably to promote redesigns of the Chevy Silverado and GMC Sierra. Toyota spent $920.4 million in the nine month period, a decrease of 1.0 percent. Marketing re-launches of the Toyota Avalon and Rav-4 models were accompanied by sizable budgets but this was offset by reduced spending for several other top-selling Toyota models in advance of their own upcoming redesigns.
L’Oreal expenditures reached $1,157.7 million in the nine month period, up 10.9 percent. The marketer has now increased its year-over-year ad spending for fifteen consecutive quarters. Berkshire Hathaway entered the Top Ten rankings by spending $868.0 million, a 3.3 percent increase. The company raised spending at its Geico insurance subsidiary to keep pace with competitors.
Measured Ad Spending By Category
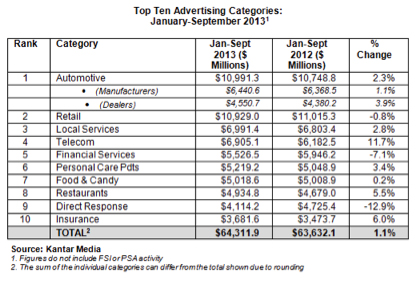
Expenditures for the ten largest categories grew 1.1 percent in the first nine months of 2013 to $64,311.9 million.
Automotive was the top category in the period with expenditures of $10,991.3 million, up 2.3 percent. Manufacturer spending rose 1.1 percent while auto dealers spent 3.9 percent more. The strong sales climate for vehicles coupled with a steady flow of marketing launches for new and redesigned models continues to push auto spending higher.
Retail was the second largest category. Expenditures totaled $10,929.0 million, a 0.8 percent decline. Cutbacks among apparel and consumer electronics retailers more than offset robust spending by mass merchandisers.
Telecom had the highest growth rate among the leading categories as year-to-date spending rose 11.7 percent to $6,905.1 million. The wireless device segment was responsible for more than one-half of category dollar growth and was driven by an extraordinary number of smartphone product launches, backed by generous ad budgets.
Fierce competition among auto insurers helped spending in the Insurance category advance by 6.0 percent to $3,681.6 million. The impact of the Affordable Care Act on the ad budgets of health insurers remained modest through the end of September.
Advertising expenditures in the Restaurant category were $4,934.8 million in the period, an increase of 5.5 percent over the prior year. Industry traffic and sales growth remained sluggish and this put pressure on marketers to try and increase share of voice in an effort to hold market share.
Year-to-date ad expenditures on Financial Services fell 7.1 percent to $5,526.5 million. Declines were prevalent across credit cards, banking, investment products and retirement products.
Thirteen of the top fifteen advertisers in the category reduced their spending, further evidence of the widespread slowdown.