U.S. Advertising Expenditures Increased 5.7 % in Q1 2014
June 24, 2014
![]() Total advertising expenditures increased 5.7 percent in the first quarter of 2014 to $34.9 billion, according to data released by Kantar Media.
Total advertising expenditures increased 5.7 percent in the first quarter of 2014 to $34.9 billion, according to data released by Kantar Media.
“The Winter Olympics delivered its expected windfall in the first quarter, adding about $600 million of incremental ad spending to the marketplace. But the nature of the event is that this money is narrowly distributed and doesn’t benefit all sectors of the market,” said Jon Swallen, Chief Research Officer at Kantar Media North America. “Subtracting the Olympics’ contribution, the growth rate for remaining expenditures was just under four percent.”
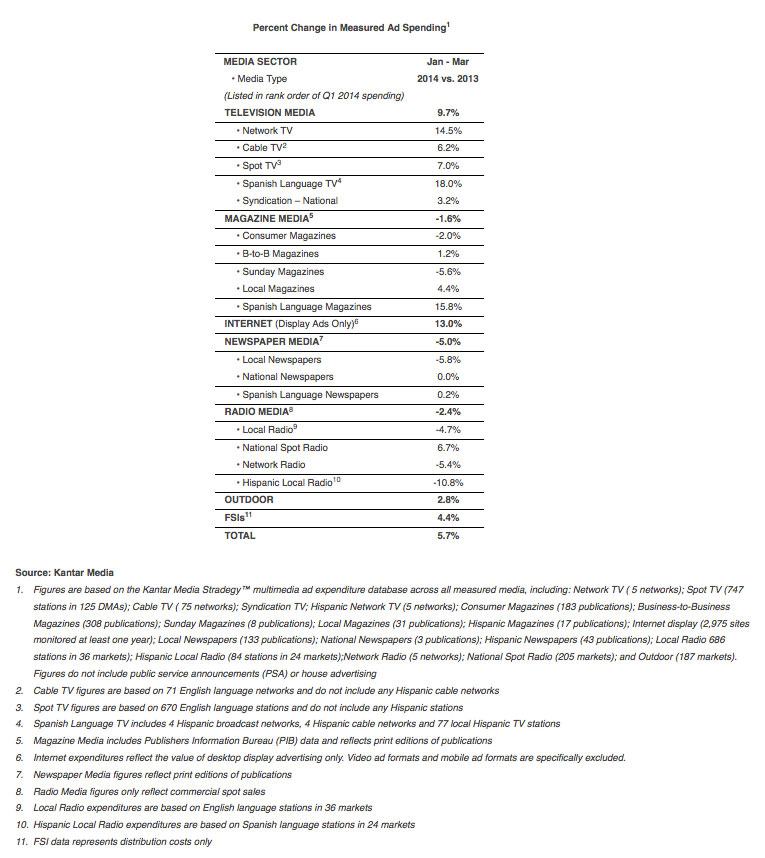
Measured Ad Spending By Media – The Winter Olympics Effect
Every measured type of television had expenditure increases in Q1. Network TV increased 14.5 percent with about one-half of this growth coming from the Winter Olympics. Higher spending on the NFL playoffs and Super Bowl also contributed to the gains.
The Olympics also gave a boost to Spot TV expenditures which rose 7.0 percent during Q1. In addition, an early rush of political spending for key races in Alaska, North Carolina and Texas were a reminder that as November elections draw closer, political money will increasingly define and drive the spot TV marketplace.
Cable TV expenditures increased 6.2 percent in Q1 on higher spending from a broad range of core categories. Spanish Language TV rose 18.0 percent in the period, primarily from gains at broadcast networks. Syndication TV spending was up 3.2 percent and received a hefty boost from pharmaceutical, insurance and restaurant marketers.
Internet display expenditures grew 13.0 percent in the first quarter as financial, retail and insurance marketers raised their budgets. Outdoor media registered a 2.8 percent increase on stronger spending within the Local Service and Retail categories.
Spending in print publications continued to retreat in Q1. Consumer Magazine print expenditures fell 2.0 percent and the key metric of ad pages declined more than five percent. The bottom line totals were skewed by severe reductions from the two largest magazine advertisers (Procter & Gamble and L’Oreal) who account for more than ten percent of total spending. Across the entire industry the number of continuing magazine advertisers that lifted spending outpaced declines by a 3:2 ratio. Ad expenditures in Sunday Magazines dropped 5.6 percent on weaker spending from pharmaceutical, financial and travel marketers.
Local Newspaper advertising decreased 5.8 percent in Q1 on commensurate declines in ad space and continuing cutbacks by local auto dealers and retailers. National Newspapers finished the period with spending unchanged compared to a year ago.
Results for Radio media were mixed. National Spot Radio was up 6.7 percent and this was driven by a larger number of brands using the medium. Local Radio, which reflects English language stations, had a spending decline of 4.7 percent and Hispanic Local Radio stations were down 10.8 percent. Both of these segments were hit by lower spending from the retail, auto dealer and restaurant categories.
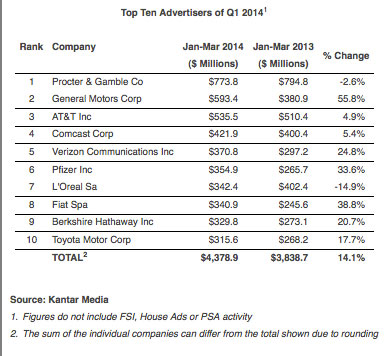
Measured Ad Spending By Advertiser – Double Digit Growth Abounds
Spending from the ten largest advertisers in the first quarter of 2014 was $4,378.9 million, a 14.1 percent increase and an aggregate gain of $540 million versus last year. Television media spending accounted for more than 80 percent of this growth and was closely associated with the Winter Olympics. Six of the top ten marketers (P&G GM; AT&T Comcast; Pfizer; and Berkshire Hathaway) had significant TV ad buys in the event.
Procter & Gamble secured the top-ranked position for Q1 with $773.8 million of ad spending, down 2.6 percent from the prior year. Increased support for personal care and paper product brands was more than offset by reductions within its cosmetics and hair care brand portfolios.
General Motors had the largest year-over-year growth rate among the Top Ten as it lifted ad spending 55.8 percent to $593.4 million. Amidst an expanding product recall, GM ad messaging remained focused on its current vehicle lineup with extra support allocated to newly redesigned versions of the Cadillac CTS, Chevy Silverado and GMC Sierra.
Two other auto manufacturers also had big spending increases that were driven by marketing launches for redesigned models. Ad expenditures from Fiat Spa rose 38.8 percent to $340.9 million and Toyota Motor was up 17.7 percent to $315.6 million.
Verizon Communications raised its ad spending by 24.8 percent in Q1 to $370.8 million as the company completed its buyout of Vodafone’s ownership stake and refocused its attention on marketing requirements for its wireless and broadband services. Rival AT&T increased spending by 4.9 percent to $535.5 million as it rolled out a new umbrella campaign with the tagline, “Building you a better network”.
Pfizer spent $354.9 million in Q1, up 33.6 percent from the prior year. The company aggressively boosted ad support for the prescription drug Celebrex in advance of a May 2014 patent expiration which opens the door to sales competition from generic alternatives.
Berkshire Hathaway ad spending rose 20.7 percent to $329.8 million in the first quarter, primarily attributable to the GEICO insurance subsidiary.
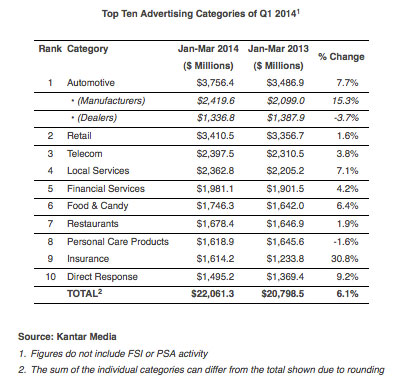
Measured Ad Spending By Category
Expenditures for the ten largest advertising categories grew 6.1 percent in Q1 to $22,061.3 million. Nine of the ten had spending increases.
Automotive was the top category with $3,756.4 million of spending, up 7.7 percent. Auto advertising continues to be propelled by a strong sales climate for new vehicles and a steady stream of model introductions and redesigns that trigger larger ad budgets.
Retail was the second largest category in Q1 with expenditures of $3,410.5 million, an increase of 1.6 percent. Strong spending from home furnishing retailers was cancelled out by steep reductions from the clothing, jewelry and food store segments.
Insurance had the largest increase among the top ten categories as expenditures rose 30.8 percent to $1,614.2 million. Fierce competition among auto insurers plus a surge of advertising for health care coverage leading up to a key Obamacare enrollment deadline were responsible for the increase.
Spending from the Food & Candy category was up 6.4 percent to $1,746.3 million. Several well-funded product introductions by candy manufacturers and the ongoing marketing battle among leading yogurt brands were the primary growth drivers.
Local Services expenditures grew 7.1 percent to $2,362.8 million. A key segment within this category is Hospitals, Medical Center & Clinics. These advertisers significantly boosted Q1 spending in the expectation that many people gaining health care insurance under the Affordable Care Act will be in the market for medical tests and procedures.
Financial Services advertising increased 4.2 percent in Q1 to $1,981.1 million. Banking companies are facing tougher regulatory capital requirements and lifted their ad spending in an effort to win more consumer deposits. Financial management and advisory services were also active with campaigns that tapped into investor’s uncertainty about the security of their nest eggs.