U.S. Advertising Expenditures +0.3 Percent in Q3 2014
December 23, 2014
![]() Total advertising expenditures increased 0.3 percent in the third quarter of 2014 to $33.7 billion, according to data released by Kantar Media, the leading provider of strategic advertising and marketing information. During the first nine months of 2014 ad spending grew 2.2 percent.
Total advertising expenditures increased 0.3 percent in the third quarter of 2014 to $33.7 billion, according to data released by Kantar Media, the leading provider of strategic advertising and marketing information. During the first nine months of 2014 ad spending grew 2.2 percent.
“After a relatively robust first half when spend grew by 3.1%,the pace of ad spending slowed during Q3 and a principal cause was Top 100 marketers becoming more restrained with their budgets,” said Jon Swallen, Chief Research Officer at Kantar Media North America. “In contrast, mid-sized advertisers, who are the core of the ad market, continued to supply foundational support and grew their total spending by 6-7 percent during the quarter.”
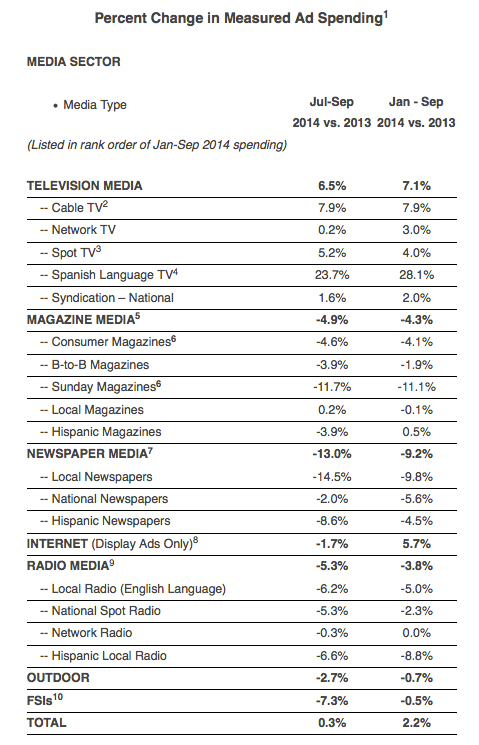
Measured Ad Spending By Media
Television ad spending increased 6.5 percent in the third quarter and was the only sector in the analysis with year-over-year growth. Spanish Language TV rose 23.7 percent and was fueled by the final two weeks of the World Cup tournament in July. Spending on Cable TV networks was up 7.9 percent in the period with roughly one-third of the gain attributable to increased commercial time. Political spending was the primary contributor to the 5.2 percent rise in Spot TV. Collectively, these three TV segments were responsible for an estimated $700 million of growth and offset the weaker results from Network TV (+0.2 percent) and National Syndication (+1.6 percent).
Q3 Internet display spending fell 1.7 percent due to fewer page views by desktop PC users, which in turn led to fewer ad impressions. (Mobile internet display spend is not included in this analysis.) Outdoor expenditures declined 2.7 percent on cutbacks from the Restaurant, Financial Service and Media categories.
Print media experienced further losses in the period. Total expenditures in Newspaper media fell 13.0 percent and reflected commensurate reductions in volume of space sold. Consumer Magazine spending dropped 4.6 percent as lower budgets from CPG and Auto advertisers erased encouraging gains from the Apparel and Pharmaceutical categories. Ad expenditures in Sunday Magazines fell 11.7 percent on lower demand from Direct Response marketers, a bellwether category for the segment. (Note that these figures are based on print channels only and do not include activity on websites or other properties operated by print brands).
Radio media also dipped during the third quarter. Local Radio ad spending on English language stations was down 6.2 percent and on Spanish language stations it fell 6.6 percent. National Spot Radio fared no better with a decline of 5.3 percent. A common outcome for each of these segments was lower spending by retail, financial service and restaurant advertisers.
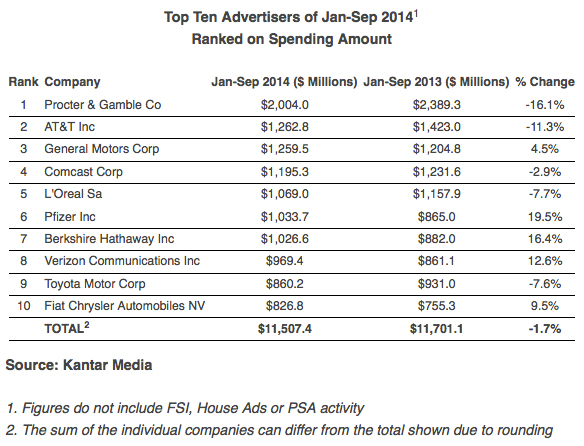
Measured Ad Spending By Advertiser
Spending by the ten largest advertisers during the first nine months of 2014 was $11,507.4 million, a 1.7 percent decrease compared to a year ago. Among the Top 100 marketers, a diversified group accounting for over 40 percent of the ad market, investments were up 1.3 percent.
Procter & Gamble claimed the top position by spending $2,004.0 million from January through September, a drop of 16.1 percent. P&G has posted three consecutive quarters of year-over-year expenditure declines. Pfizer had the highest growth rate within the Top Ten, up 19.5 percent to $1,033.7 million. The company continues to expand marketing programs for top-selling Rx brands that are under patent protection and don’t yet face competition from cheaper generic alternatives.
Two telecom advertisers landed in the Top Ten but their ad budgets moved in opposite directions. AT&T was the second largest advertiser even though it trimmed expenditures 11.3 percent to $1,262.8 million. Verizon raised its investments 12.6 percent to $969.4 million.
Auto manufacturers had contrasting results that were primarily shaped by the number and timing of marketing launches. At General Motors, ad spending increased 4.5 percent to $1,259.5 million. This gain was focused on the first three months of 2014 when the company re-launched its two best-selling truck brands, providing a cushion against softer spending levels in Q2 and Q3. Toyota Motor expenditures totaled $860.2 million, a 7.6 percent decrease, and reflect fewer marketing launches compared to last year. Fiat Chrysler increased its media spending 9.5 percent to $826.8 million on higher budgets from the Chrysler and Jeep divisions
Berkshire Hathaway lifted its spending 16.4 percent to $1,026.6 million, primarily in support of the GEICO brand.
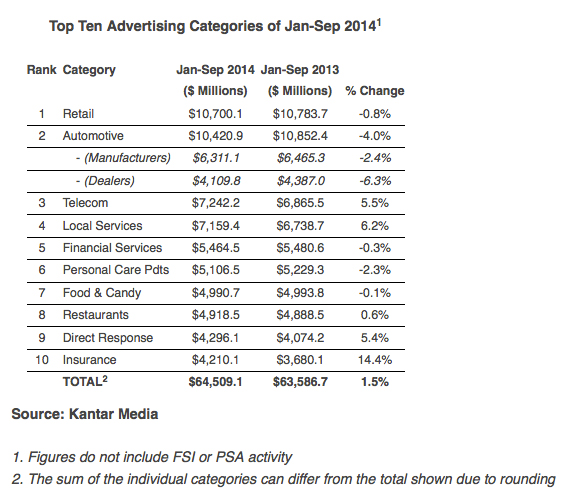
Measured Ad Spending By Category
Expenditures for the ten largest advertising categories grew 1.5 percent to $64,509.1 million in the first nine months of 2014. However, Q3 spending for this same group fell 1.1 percent.
Retail was the top category with January-September expenditures of $10,700.1 million, a 0.8 percent decrease. A broad slowdown in advertising during the summer months, most notably among department stores and clothing retailers, has pushed the category into negative territory.
Automotive was the second largest category with measured ad spending of $10,420.9 million, a 4.0 percent decline. The reduction came from both manufacturers (-2.4 percent) and dealers (-6.3 percent). Auto spending has recently lagged because there have been fewer big-scale marketing launches versus a year ago.
The Insurance category had the strongest growth rate among the Top Ten with ad spend rising 14.4 percent to $4,210.1 million. Aggressive competition for market share among auto insurers continues to translate into higher ad spending. New campaigns from Liberty Mutual and Nationwide also helped results.
Telecom expenditures finished at $7,242.2 million, an increase of 5.5 percent. Spending from wireless providers has grown modestly throughout the year. Q3 launches by Amazon and Apple for new smartphone models also contributed to the gain.
Ad expenditures for Local Services increased 6.2 percent to $7,159.4 million on steadily higher spending from both Medical Service providers and service businesses connected to home ownership and the housing industry.
Advertising support for Personal Care Products reached $5,106.5 million, down 2.3 percent compared to a year ago. Lower spending by category leaders more than offset double digit increases among the next tier of competitors.