
What we know about internet use, smartphone ownership and digital divides in the U.S.
January 15, 2026
For 25 years, Pew Research Center has tracked some of the biggest technological shifts in history.
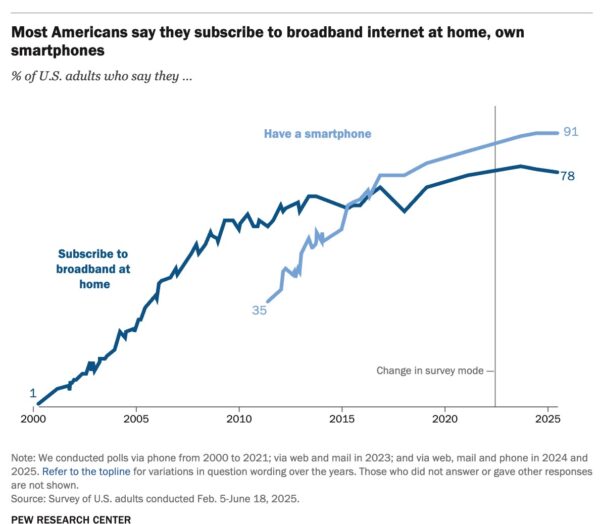
Today, most Americans subscribe to home broadband internet and own a smartphone. About four-in-ten describe their internet use as almost constant.
But use of these technologies is not universal. For instance, Americans with the lowest household incomes are far less likely than their higher-income peers to subscribe to broadband internet at home.
How often do Americans go online?
Screen time for kids and teens often makes headlines. At the same time, many adults spend lots of time in front of screens, too.
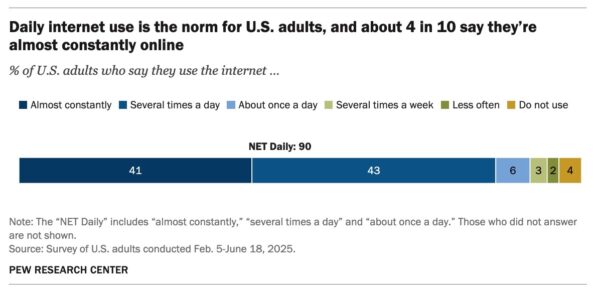
Nine-in-ten U.S. adults use the internet daily, including 41% who say they’re online almost constantly. This is on par with what we found in 2023 and 2024.
By demographic groups
Vast majorities across demographic groups go online daily. But there are big differences in near-constant internet use.
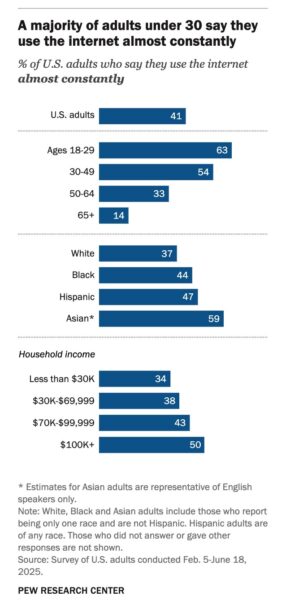
Some of the largest differences are by age. A majority of adults ages 18 to 29 (63%) say they’re online almost constantly. This share falls to 14% of those 65 and older.
There are also differences by household income. Today, half of adults who live in households earning $100,000 or more annually say they’re online almost constantly. Adults with lower incomes are less likely to say this. Still, 34% of those making under $30,000 annually are online this often. We’ve seen differences by income in recent years, too.
In addition, today 59% of Asian adults are online almost constantly. Hispanic and Black adults are less likely to say this, and White adults are the least likely.
Who has home broadband internet?
We also track what kinds of internet subscriptions people have – including who subscribes to broadband.
Today, about eight-in-ten Americans say they subscribe to broadband at home. Broadband – also commonly known as high-speed internet – includes a range of ways to get online, from wireless routers to cable to satellite internet. (For more on how we defined this, read the questionnaire.)
By demographic groups
Over the years, some of the biggest and most consistent divides in home internet access have been by household income. That remains true today.
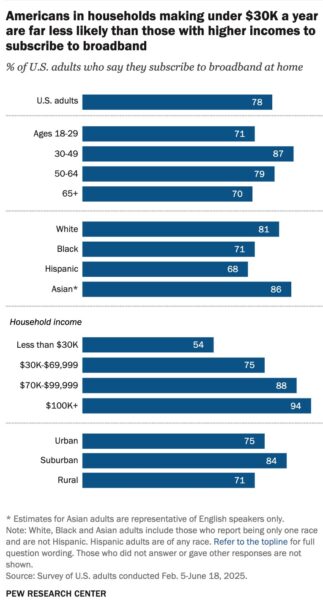
Americans in households making under $30,000 a year are far less likely than those with higher incomes to subscribe to home broadband. In this lowest-income group, 54% do, compared with 94% of those in the highest-income households – a 40 percentage point gap.
When it comes to the communities people live in, urban and rural Americans subscribe to home broadband at similar rates. But both groups are less likely than suburban adults to do so.
Black and Hispanic adults are also less likely than White or Asian adults to subscribe to broadband.
Changes over time
Overall, the share of Americans who subscribe to broadband has held fairly steady in the past few years. That’s also true for many demographic groups.
But between 2023 and now, it dipped slightly among young adults and Hispanic adults:
- 71% of those ages 18 to 29 now subscribe to broadband at home, down from 78% in 2023.
- 68% of Hispanic adults do, down from 75% in 2023.
For more on how these shares have changed over the past two decades, read our fact sheet on internet and broadband use.
Who has a smartphone?
Smartphones are common in America today. Vast majorities across age, income, racial and ethnic groups own one.
For example, 97% of adults under 50 and 90% of those ages 50 to 64 have a smartphone. Those 65 and older are least likely to own one, but 78% of them still do.
Who relies on smartphones for internet access?
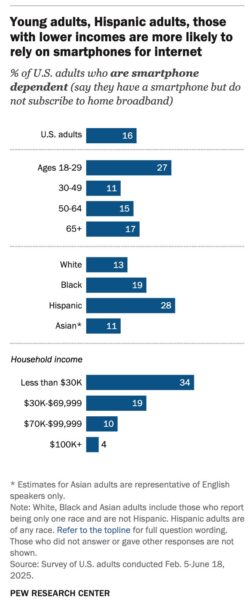
For some people, smartphones are a key way to access the internet. Today, 16% of adults are “smartphone dependent” for internet use, meaning they have a smartphone but don’t subscribe to home broadband.
By demographic groups
Americans with lower incomes are not just less likely to subscribe to broadband at home. They’re also more likely to rely on their smartphones for internet. About a third of those in households earning less than $30,000 annually are smartphone dependent, compared with 4% of those earning $100,000 or more.
Adults under 30 are more likely than older Americans to be smartphone dependent. Hispanic adults stand out too, followed by Black adults and smaller shares of White and Asian adults.
Changes over time
The share of Americans who are smartphone dependent has grown from 8% in 2013 to 16% today.
Over the last few years, that overall share has remained stable. But we see some recent change for Hispanic adults – from 2023 to now, the share of this group that is smartphone dependent ticked up from 20% to 28%.


