
Falling Population of Foreign-Born in Puerto Rico Mirrors Island’s Drop in Total Population
May 24, 2024

Puerto Rico’s foreign-born population slipped below 100,000 in 2018-2022 from a decade earlier, according to the most recent American Community Survey (ACS) five-year estimates. The island’s foreign-born population declined by roughly 15,000, from 104,497 in 2008-2012 to 89,461 a decade later.
Foreign-Born Population
The foreign-born population is composed of anyone who is not a U.S. citizen at birth. This includes persons who have become U.S. citizens through naturalization as well as lawful permanent residents (immigrants), temporary migrants (such as foreign students), humanitarian migrants (such as refugees and asylees), and unauthorized migrants. Everyone else is counted among the native-born population, which comprises anyone who is a U.S. citizen at birth, including people born in the United States, Puerto Rico, a U.S. Island Area (Guam, the Commonwealth of the Northern Mariana Islands, and the U.S. Virgin Islands), or abroad to a U.S. citizen parent or parents.
This drop was in line with an overall decline in Puerto Rico’s total population, which decreased from 3.7 million to 3.3 million between 2008-2012 and 2018-2022. While this trend may largely reflect falling birth rates, the island was also hit by natural disasters and economic crises that accelerated net outmigration.
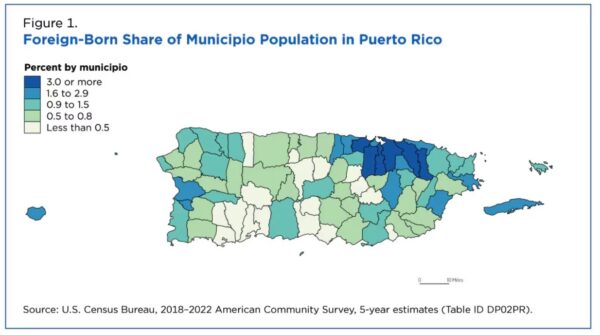
The latest ACS estimates reveal that like Puerto Rico as a whole, roughly a fifth of all municipios experienced a drop in their immigrant populations.
The 2018-2022 ACS estimates provide a snapshot of how Puerto Rico’s foreign-born population changed in the face of these challenges: It got older; became less active in the labor force; and left Puerto Rico or chose not to come in recent years.
While flows from historical countries of origin like the Dominican Republic and Cuba slowed, those from other places of birth — particularly South America — picked up.
The latest ACS estimates reveal that like Puerto Rico as a whole, roughly a fifth of all municipios experienced a drop in their immigrant populations. Even the top municipios where the foreign-born lived were not immune to these trends.
San Juan (11.3% foreign-born) and its neighboring municipios, Carolina (6.3% foreign-born), Guaynabo (5.7% foreign-born), Canóvanas (4.0% foreign-born) and Bayamón (3.9% foreign-born) saw their foreign-born populations drop by more than 12,000 from a combined total of 74,483 in 2008-2012 to 62,095 in 2018-2022 (Figure 1).
Age of Foreign-Born
The decline in the island’s foreign-born population was reflected in the decrease in the foreign-born civilian employed population, which also fell by over 12,000 between 2008-2012 and 2018-2022.
Although a greater share (55.7%) of immigrants 16 years and over were in the labor force compared to the corresponding native-born population (44.5%), the proportion of the foreign-born not working or looking for employment rose from 36.5% in 2008-2012 to 44.3% in 2018-2022.
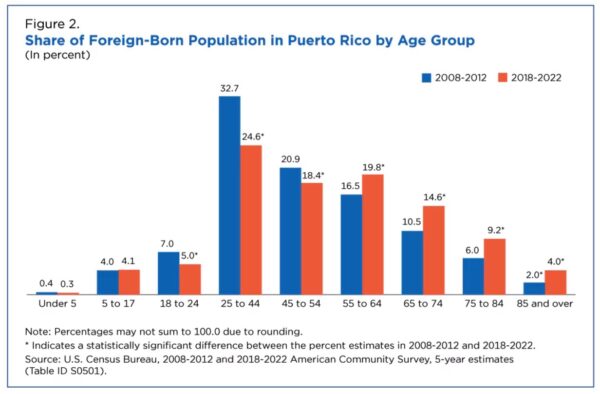
Such shifts were not surprising given how the foreign-born population in Puerto Rico has aged over the decade.
The median age of the foreign-born population increased by over 6 years to 53.9 (from 47.7 in 2008-2012), making the foreign-born older than the native-born population (median age 43.4). In addition, the age distribution of the foreign-born population shifted: both younger adult age groups narrowed and older adult age groups grew significantly between these data periods (Figure 2).
Origins of Foreign-Born
Two factors affected the age of the foreign-born population: whether immigrants who came to Puerto Rico stayed (and aged there) and whether more recent arrivals left. Estimates of immigrants by region of birth and period of entry shed some light on this.
Where Immigrants Were Born
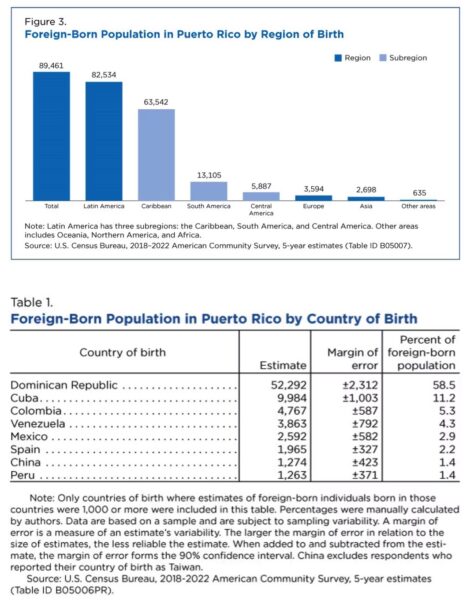
Most immigrants in Puerto Rico were born in Latin America (92.3 %) and the Caribbean was the dominant subregion of birth (Figure 3).
The largest foreign-born groups in Puerto Rico were from the Dominican Republic (58.5%) and Cuba (11.2%). Due to their proximity to the island, these countries have a long history of large migratory flows to Puerto Rico (Table 1).
A significant chunk was also from South America (14.6%) and Central America (6.6%), followed by those born in Europe (4.0%) and Asia (3.0%). Top countries of birth from these Latin American subregions included Colombia, Venezuela, Mexico, and Peru.
When Immigrants Arrived in Puerto Rico
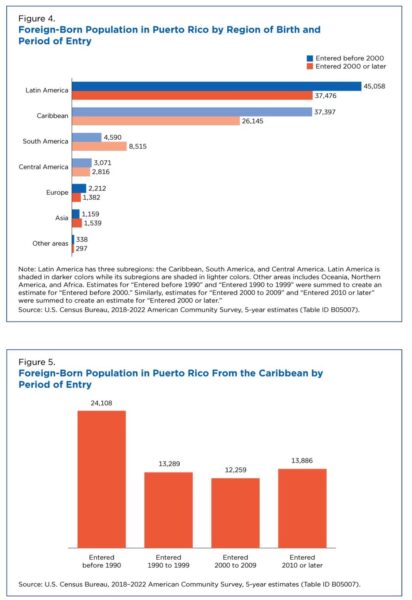
While the foreign-born population was roughly split between those entering Puerto Rico before 2000 (54.5%) and those entering in 2000 or later (45.5%), there were wide variations by region and subregion of birth.
Around 75% of the immigrants who arrived before 2000 were born in the Caribbean (Figure 4). However, net flows from this subregion fell in more recent periods of entry.
The estimate of the Caribbean-born who arrived before 1990 (24,108) was about double the estimate of those who entered in any subsequent period of entry (Figure 5). Later estimates plateaued under 14,000, suggesting net flows from the Caribbean to Puerto Rico slowed in recent decades.
As a result, the number of foreign-born who arrived in 2000 or later was smaller than the number that arrived earlier. The Caribbean-born continued to account for the majority of recent arrivals but to a smaller degree than among earlier arrivals.
However, this drop was partially offset by a rise in the foreign-born from South America. The estimate of immigrants born in South America who entered Puerto Rico in 2000 or later was 1.9 times larger than the estimated number that entered before 2000 (Figure 4).
About Authors
Joyce Hahn is a demographic statistician with the Foreign-Born Population Branch in the Census Bureau’s Population Division.
Lauren Medina is the Chief of the Foreign-Born Population Branch in the Census Bureau’s Population Division.


