
Hispanic Population Is Younger But Aging Faster Than Non-Hispanic Population
June 1, 2023

While younger than the non-Hispanic population, the Hispanic or Latino population has aged faster over the past decade, according to 2020 Census data.
Despite that, children of Hispanic or Latino origin in 2020 made up a quarter of all children under age 18 in the United States. And in states where their numbers increased the most, the total counts of children often decreased, the data show.
Throughout this article, we refer to the Hispanic or Latino population as the Hispanic population.
- The Hispanic population’s median age in 2020 was 30.0, up 2.7 years from 2010. The non-Hispanic population was older but aged at a slower rate: median age was 41.1 in 2020, up 1.5 years from 2010.
- The data show 1 in every 4 children, 25.7% (18.8 million), in the United States were of Hispanic origin in 2020, up from 23.1% (17.1 million) in 2010.
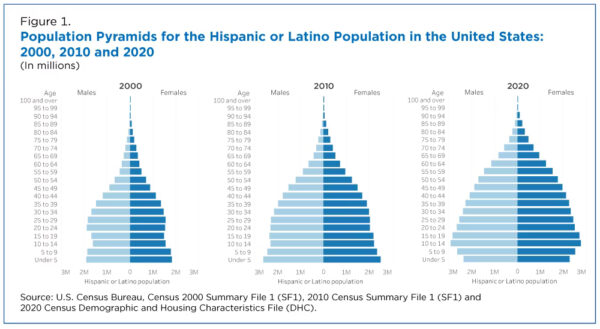
The population pyramids below provide a clear picture of the changing sex and age distribution of the Hispanic and the non-Hispanic populations for a selected Census year. In 2010, the shape of the Hispanic population pyramid (Figure 1) was triangular, indicating a younger population. It maintained a similar shape in 2020 but there was a decrease in the proportion of the population under age 10.
In contrast, the non-Hispanic population pyramid (Figure 2) had a more rectangular shape in 2010, gradually narrowing as age increased, with a large proportion in the 45-54 age group. By 2020, the non-Hispanic population pyramid was more urn-shaped, indicating an aging population. A larger proportion of that population was age 55 and older and a smaller proportion of the population was under age 20.

Number of Hispanic Children Grew 2010-2020
The data show 1 in every 4 children, 25.7% (18.8 million), in the United States were of Hispanic origin in 2020, up from 23.1% (17.1 million) in 2010.
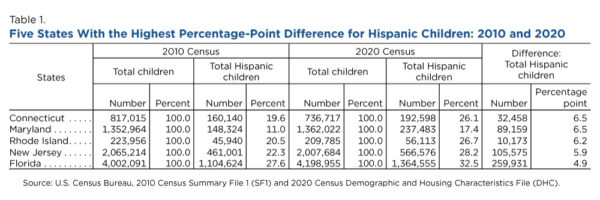
States with the largest percentage point increases in their proportion of Hispanic children over the decade: Connecticut, up 6.5 percentage points; Maryland, up 6.5; Rhode Island, up 6.2; New Jersey, up 5.9; and Florida, up 4.9 (Table 1).
Among them, New Jersey and Florida each added over 100,000 Hispanic children over the decade. Florida experienced the largest numeric increase across all states, adding over a quarter million Hispanic children to its population from 2010 to 2020.
In three of the five states (Connecticut, New Jersey, Rhode Island), the total number of children declined between 2010 and 2020 while the number of Hispanic children increased.
Multiracial Hispanic Population Grows Most in the South
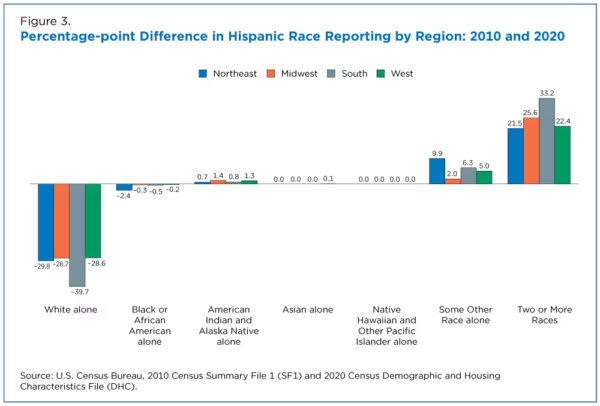
Figure 3 highlights the changes in race reporting from 2010 to 2020. The Hispanic population in the South saw the biggest changes in race reporting patterns.
In 2010, the majority of the Hispanic population in the South reported their race as White alone (62.9%). By 2020, only 23.2% reported as White alone. All regions saw a decrease in White alone reporting for the Hispanic population over the decade, with the sharpest decline (nearly 40%) in the South.
In 2020, the Hispanic population reporting Two or More Races (referred to in this story as the Multiracial population) was highest (37.9%) among the Hispanic population in the South.
The Hispanic population reporting as Some Other Race alone increased the most in the Northeast, from 38.3% in 2010 to 48.2% in 2020. In contrast, the Hispanic population in the Northeast reporting as Black or African American alone (referred to in this story as the Black alone population) decreased the most compared to all other regions, from 7.2% to 4.8% during the period.
Comparisons between race data in the 2020 and 2010 censuses should be made with caution, taking into account improvements to the Hispanic origin and race questions and changes in the way responses were coded in the 2020 Census.
The shifts in median age of the Hispanic population over the past decade varied by race.
While the total Multiracial population had the youngest median age (29.5) of all race groups, the Multiracial Hispanic population had the oldest median age (31.3) across all Hispanic by race groups.
The Multiracial Hispanic population aged the fastest (by 10.8 years) from 2010 to 2020. The oldest Multiracial Hispanic populations were in states (and state equivalents) with large Hispanic populations, such as Puerto Rico, median age 45.3; Florida, 39.6; and New Mexico, 35.1.
Comparisons between race data in the 2020 and 2010 censuses should be made with caution, taking into account improvements to the Hispanic origin and race questions and changes in the way responses were coded in the 2020 Census.
Black Alone, Hispanic Population Youngest of All Hispanic Groups
The Black alone, Hispanic population experienced the largest decrease in median age: a drop of 2.1 years, from 24.0 in 2010 to 21.9 in 2020.
The Black alone, Hispanic population was the youngest of all Hispanic race groups in 2020 with a median age under 18 in eight states: Wyoming (16.2); Nebraska (16.8); Oklahoma (17.0); Texas (17.3); New Mexico (17.4); Arizona (17.5); and Indiana and Iowa (each at 17.6). This indicates that most of the Black alone, Hispanic population in these states were children.
The median age for the Some Other Race alone, Hispanic population (the largest reported race group for the Hispanic population) increased by 4.2 years during the decade to 30.7 in 2020. The White alone, Hispanic population’s median age decreased by 1.7 years to 27.2 in 2020. In contrast, the White alone, Not Hispanic population’s median age increased by 2.5 years to 44.5 in 2020.
Hispanic Population Aging Faster in Puerto Rico Than Stateside
The median age for the Hispanic population in Puerto Rico was 45.1 in 2020, 15.1 years older than the national median age of the total Hispanic population stateside (Figure 4), and older than all states and the District of Columbia.
From 2000 to 2020, the Hispanic median age in Puerto Rico increased 13 years, from 32.1 to 45.1. In contrast, the median age for the total Hispanic population stateside increased by only 4.2 years, from 25.8 to 30.0.

All the authors are in the Census Bureau’s Population Division:
- Jessica Peña is a senior researcher in the Race/Ethnicity Research & Outreach Area.
- Magdaliz Álvarez Figueroa is a demographic statistician in the Ethnicity and Ancestry Branch.
- Merarys Rios-Vargas is chief of the Ethnicity and Ancestry Branch.
- Rachel Marks is chief of the Racial Statistics Branch.


