
How Does Diversity in Social Networks Impact Survey Response?
March 6, 2024

Survey professionals, including U.S. Census Bureau researchers and statisticians, have been grappling with how to maintain data quality when survey response rates are declining.
There have been various explanations for the decline in survey response rates that can jeopardize the quality of the data. Among them is the social capital hypothesis, which attributes the drop to declining social capital — the strength of people’s friendship networks and community ties.
People less socially integrated or less involved in community service may not relate to or be motivated by the idea of community benefits, prompting them to not respond to the survey.
One important aspect of social capital is social networks, which describe who people’s friends and acquaintances are and how often people have friends from different backgrounds.
The Census Bureau explored the relationship between people’s social network and nonresponse rates and data quality and found that low survey response and data quality could be affected not only by the strength of people’s social networks but by how diverse they are.
The research showed, for example, that areas of the United States where people are part of more exclusive and economically similar social networks had lower response rates to the American Community Survey (ACS) than areas of the country that have less exclusive and more economically diverse social networks.
Social Networks and Survey Response
The ACS highlights the benefits of answering the survey to a respondent’s community. Specifically, the survey invitation letter ACS households receive states their response can help their community make plans for public services like roads, schools and health care facilities.
People less socially integrated or less involved in community service may not relate to or be motivated by the idea of community benefits, prompting them to not respond to the survey.
Social capital is a multi-faceted concept that involves many ways people interact. While a lot of research and discussion has focused on Americans becoming more socially isolated and how it’s affecting various societal outcomes, the diversity of someone’s friendship network may also be key to understanding how social connections influence survey participation behavior.
In this research, we use recent statistics released in 2022 on people’s social connections to examine how these measures could be related to data quality in the ACS.
A group of researchers from Harvard University, Stanford University, New York University and from Meta analyzed 21 billion Facebook relationships to create county-level estimates of people’s social connections.
They released statistics showing how likely a person is to have friends from a different socio-economics status (economic connectedness) and how insular people’s social networks are (clustering). The latter is measured by randomly picking two friends of a person and determining how often these two friends are also friends with each other. Both these statistics measure the diversity of people’s friendship networks.
We linked these publicly available data to ACS response rates and nonresponse bias measures at the county level to examine how these social capital measures relate to data quality and response rates of the ACS.
What is Nonresponse Bias?
Nonresponse bias is a measure of differences between survey respondents and the population as a whole. For example, retired individuals may be more likely to respond to surveys because they have more free time to respond and are more likely to be at home when an interviewer shows up on their doorstep.
It is important to look at nonresponse bias and response rates since lower response rates don’t necessarily lead to nonresponse bias. That is, low response rates become problematic only when they lead to nonresponse bias. We linked ACS sampled addresses to administrative data from the Internal Revenue Service, Social Security Administration, 2010 and 2020 Censuses and other sources to construct our measures of ACS nonresponse bias.
This data linkage provides measures of how ACS respondents and nonrespondents compare in terms of income, age, sex, race, marital status and disability.
Note that our research examines nonresponse bias before any weighting adjustments. Weighting adjustments, such as those done for the ACS, are a tool surveys use to greatly reduce nonresponse bias in the final statistics.
Additionally, the administrative data were similar to information collected in the ACS but there were some conceptual differences between taxable income and total household income for the ACS, for example.
Maps of Response Rates and Social Connections
How is ACS data quality related to social network diversity?
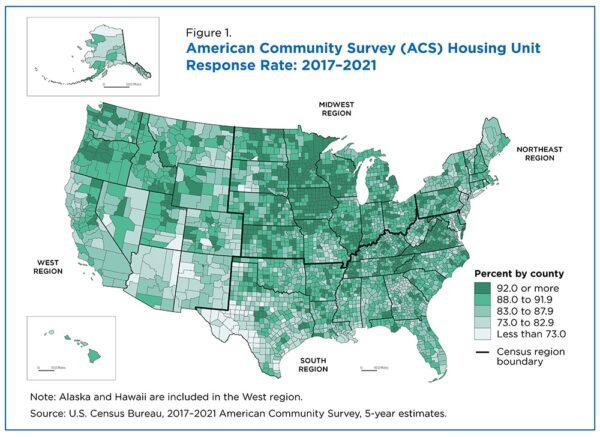
Figure 1 shows response rates to the ACS between 2017 and 2021 by county. Response rates were lower in the Southwest and higher in the Midwest.
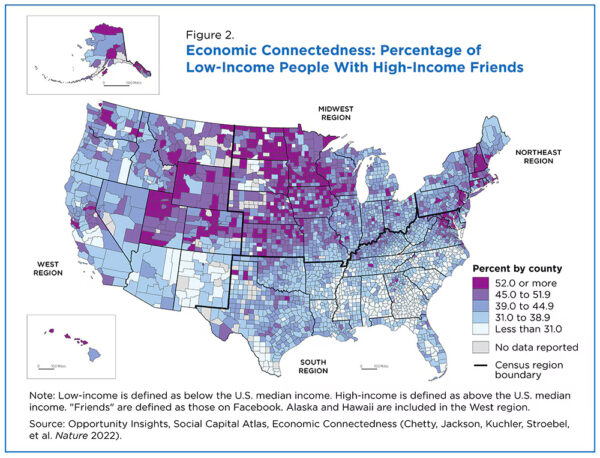
Figure 2 shows that economic connectedness — how people are connected to individuals in different income brackets than their own — derived from the Facebook data was lower in the South and higher in the rural Midwest.
Economic connectedness was low in some of the same areas that had low ACS response rates and high in some of the same areas that had high ACS response rates.
These figures suggest there is a relationship between response rates and economic connectedness.
Social Network Diversity and ACS Data Quality
To further explore the relationship between ACS data quality and social network diversity, we conducted correlation analyses. Correlations vary between -1 and 1. A correlation of 0 means that two variables have no relationship to each other, while a value of -1 or 1 shows a perfect (either positive or negative) relationship between them.
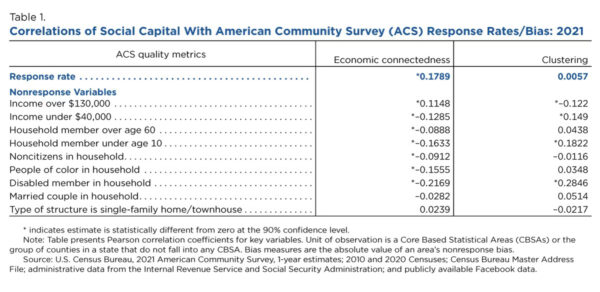
Table 1 shows that the correlation between response rates and economic connectedness — the variables mapped in Figures 1 and 2 — is 0.1789. This means there is a relationship but a weak one between these variables. In other words, while social network diversity may be related to some of the variation in ACS response rates across the country, a combination of other variables likely explains the rest of the variation.
For our nonresponse bias measures, which capture how different ACS respondents are from the population as a whole, the correlation for most of the bias variables and economic connectedness was negative. This means that areas where people had more diverse social networks had lower nonresponse bias (better data quality).
The right column of Table 1 shows the relationship between clustering and quality measures. The relationship here isn’t as strong — the correlations are significant for fewer variables in tables. But for most of the bias variables with a significant correlation, higher clustering (more insular social networks) was associated with higher nonresponse bias.
It is particularly interesting that social clustering was related to more nonresponse bias in households in which a member of the household had a disability and in those with children under 10 years old. These groups are of particular concern when considering hard-to-count populations.
What the Research Tells Us
We provide new evidence that the social capital hypothesis is more than a simple tale of social isolation. While people who had more social connections could be more civically engaged and likely to respond to a government survey, the characteristics of people’s social networks may also matter.
Having more exclusive family or neighbor connections could be associated with having a more insular social network and a leeriness to respond to interview requests from outsiders.
These results suggest that having survey takers come from the same community they are surveying may result in higher cooperation rates — a practice the Census Bureau already employs when possible.
To download report, CLICK HERE.
About Authors
- Jonathan Eggleston is a senior economist in the Census Bureau’s Center for Economic Studies.
- Chase Sawyer is a technical lead for Data Product Development in the Census Bureau’s Social, Economic and Housing Statistics Division.


