
Married Couple Households Still the Majority but Share Varied by Geography in 2021
March 28, 2024

Despite a decades-long decline, coupled households remained the most common type of U.S. living arrangement in 2020 though shares varied across states and counties.
Coastal areas in the East and West and urban counties tended to have higher shares of same-sex married and unmarried couple households.
A recently released data visualization, Coupled Households in the United States: 2017-2021, shows the county-level distribution of four types of coupled households in the United States:
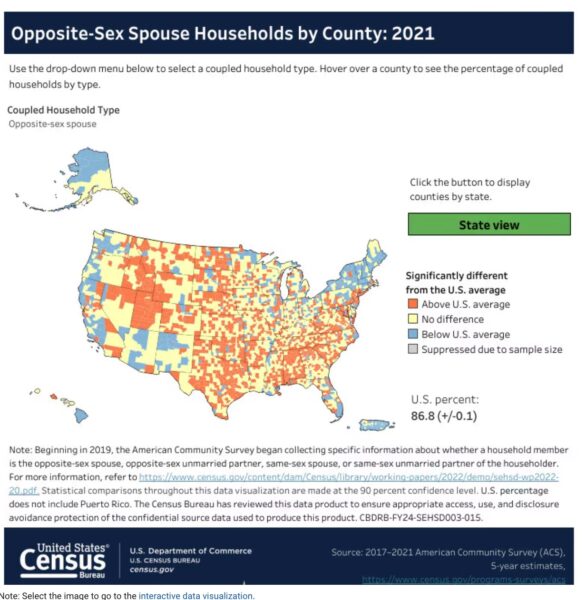
- Opposite-sex married couple households made up the greatest share (86.8%).
- Opposite-sex unmarried partner (or cohabiting) households were the next largest share (11.6%).
- Same-sex married couple households made up 0.9%.
- Same-sex unmarried partner households accounted for the smallest share (0.6%) of coupled households.
In 2019, the American Community Survey (ACS) added separate categories for same-sex and opposite-sex spouses and unmarried partners, resulting in a more accurate picture of the nation’s coupled households.
While the Census Bureau provides detailed couple-type information in tables available on data.census.gov, this visualization provides the county level information about the prevalence of opposite- and same-sex married- and unmarried-couple households.
Opposite-Sex Married Couple Households
While married-couple households made up the greatest proportion of coupled households, their share has been in steady decline over the past several decades. From 1968 to 2018, the share of adults ages 25 to 34 living with a spouse decreased from 81.5% to 40.3%, while the share living with an unmarried partner increased from 0.2% to 14.8%.
In 1960, 67.6% of the population age 15 and over were married, compared to 50.8% in 2021. The decline in the share of opposite-sex married couple households has been linked to a variety of social forces including increased educational and employment opportunities for women, increasing median age at first marriage, and changes in public attitudes toward alternative living arrangements like cohabitation and living alone. Same-sex marriage was not legal in all 50 states until 2015.
There were higher concentrations of opposite-sex married couples than the national average throughout the South and in several western states such as Idaho, Utah and Wyoming.
None of the counties in Alabama, Idaho and Utah were lower than the national average.
There were lower shares than the national average of opposite-sex married couples in the Northeast and several states in the West, such as Arizona, California, New Mexico, Oregon and Washington. No counties in Alaska, Delaware, Maine, New Hampshire, and Vermont had percentages of opposite-sex married couples that were higher than the national average.
Share of Opposite-sex Unmarried Partner Households Increasing
While less prevalent than opposite-sex married households, opposite-sex unmarried partner households became increasingly common as many young adults chose to delay or forgo marriage and live in alternative arrangements.
Many of the counties that had higher shares of opposite-sex married couples than the national average had shares of opposite-sex unmarried couples below the national average and vice versa.
Same-Sex Coupled Households
Although the number of same-sex households in the United States increased in recent years to over 1 million in 2021, they were not evenly distributed throughout the country.
Coastal areas in the East and West and urban counties tended to have higher shares of same-sex married and unmarried couple households. Among them: Kings and New York counties in New York; Los Angeles and San Francisco counties in California; King County, Washington; Broward County, Florida; Cook County, Illinois; Davidson County, Tennessee; Fulton County, Georgia; and Hennepin County, Minnesota.
About Authors
- Laquitta M. Walker and Lydia R. Anderson are family demographers in the Social, Economic, and Housing Statistics Division’s Fertility and Family Statistics Branch.


