More Counties Saw Population Gains in 2023
March 15, 2024

U.S. counties experienced population gains than losses in 2023, as counties in the South saw faster growth and more Northeast and Midwest counties had population losses turn to gains, according to the U.S. Census Bureau’s Vintage 2023 estimates of population and components of change.
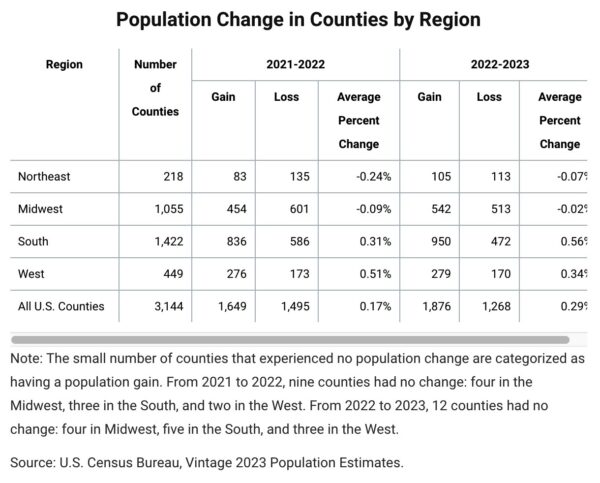
Approximately 60% (1,876) of U.S. counties gained population from 2022 to 2023, an increase from the 52% of counties (1,649) that experienced population growth between 2021 and 2022. Among the nation’s 3,144 counties, the average change from 2022 to 2023 was 0.29%, up from 0.17% the previous year.
Percent Change in County Population: July 1, 2022, to July 1, 2023
“Domestic migration patterns are changing, and the impact on counties is especially evident,” said Lauren Bowers, chief of the Census Bureau’s Population Estimates Branch. “Areas which experienced high levels of domestic out-migration during the pandemic, such as in the Midwest and Northeast, are now seeing more counties with population growth. Meanwhile, county population growth is slowing down out west, such as in Arizona and Idaho.”
This was the first time since 2020 that more counties in the Midwest had population gains (542) than losses (513), narrowing the average annual change among the region’s 1,055 counties to a loss of 0.02% from a loss of 0.09% a year earlier.
While the Northeast still had more counties losing (113) than gaining (105) population in 2023, population loss among its counties moderated compared to the previous year. The average annual change among the region’s 218 counties slowed from -0.24% to -0.07% in 2023. The number of counties with population increases rose from 83 in 2022 to 105 in 2023.
On average, counties in the South experienced faster growth in 2023 than in 2022. Among its 1,422 counties, the average annual change was 0.56%, up from 0.31% the prior year. Approximately 67% (950) of the counties in the region experienced population gains in 2023, up from 59% (836) in 2022.
The West, whose average population change ranked highest among the four regions in 2022, fell behind the South in 2023. The average annual change among the region’s 449 counties slowed from 0.51% to 0.34%.
On average, large and moderate-sized counties grew while small counties got smaller. Among the 618 counties with populations over 100,000, the average change from 2022 to 2023 was 0.76%. Moderate-sized counties with populations between 10,000 and 100,000 grew 0.36% on average. Conversely, among the 741 smallest counties in the nation, those with populations below 10,000, the average annual decrease was 0.27% in 2023 compared to 0.35% the previous year.
Components of Change – Domestic Migration
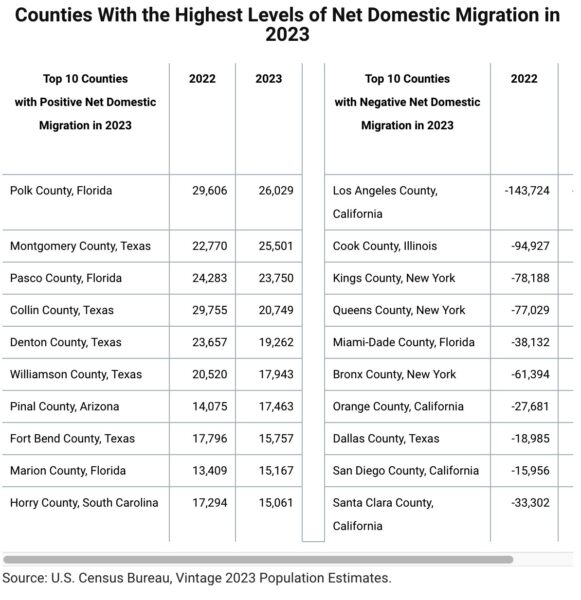
Sixty-two percent of counties, up from 60% in 2022, experienced positive net domestic migration in 2023. In addition, net domestic migration generally moderated among some of the counties with the largest amounts of net domestic in-migration and out-migration in 2022. The 10 counties with the largest net domestic in-migration were mostly in the South. In contrast, the top 10 counties with largest net domestic out-migration were mostly in large metro areas, with some experiencing considerably less net domestic out-migration in 2023 than in 2022.
The number of counties with positive net domestic migration increased in all regions except the West, where 253 counties experienced positive domestic migration in 2023, down from 275 counties in 2022. The Northeast saw the largest increase in the share of counties with positive domestic migration from 44% in 2022 to 52% in 2023. The number of southern counties with positive rates of domestic migration increased from 957 in 2022 to 1,014 in 2023, while the number of those counties in the Midwest increased from 561 to 581.
International Migration
Eighty percent (2,515) of U.S. counties had positive net international migration in 2023. Miami-Dade County, Florida (54,457), and Harris County, Texas (41,665), had the largest gains from net international migration. All counties in Connecticut, Delaware, Maine, Maryland, Massachusetts, New Jersey, and Rhode Island experienced positive net international migration.
Natural Change
As the nation’s death rate declined in 2023, so did the frequency of natural decrease. Deaths outnumbered births in fewer counties: 2,171 or 69% experienced natural decrease, down from 2,337 (74.3%) in 2022.
Just over 70% of counties in the Northeast, South and Midwest regions had natural decrease. The West was the region with the lowest share, 241 (53.7%) of its 449 counties experiencing natural decrease in 2023.
Maine was the only state where all counties experienced natural decrease. Other states where a majority of counties had natural decrease were Alabama (55 of 67); Arkansas (66 of 75); Illinois (86 of 102); Kentucky (100 of 120); Michigan (73 of 83); Ohio (71 of 88); Pennsylvania (57 of 67); and Tennessee (82 of 95).
Five Florida counties led the nation in natural decrease: Pinellas (4,945); Sarasota (3,399); Brevard (3,044); Volusia (3,003); and Marion (2,480).
Births outnumbered deaths in 961 counties (31%) in 2023, led by Alaska (with 25 of 30 counties) and New Jersey (with 17 of 21).
Nationally, the counties with the highest levels of natural increase in 2023 were Harris County, Texas (34,695); Los Angeles County, California (22,216); Dallas County, Texas (19,550); Kings County, New York (14,174); and Tarrant County, Texas (13,010).
More County Highlights
Population Change
Approximately 96% of Florida’s 67 counties grew (and only three counties lost population) from 2022 to 2023. Other states, where a large majority of counties grew, included Idaho, where 95.5% or 42 of its 44 counties gained residents, and Tennessee, where 94.7% or 90 of its 95 counties gained residents.
Fastest Growing
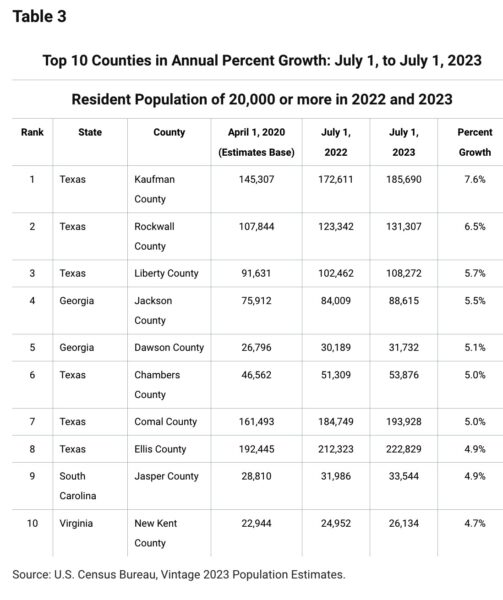
Among counties with a population of 20,000 or more, the 10 fastest-growing were in the South—six in Texas (Kaufman, 7.6%; Rockwall, 6.5%; Liberty, 5.7%; Chambers, 5.0%; Comal, 5.0%; Ellis, 4.9%); two in Georgia (Jackson, 5.5%; Dawson, 5.1%); and one each in South Carolina (Jasper, 4.9%) and Virginia (New Kent, 4.7%).
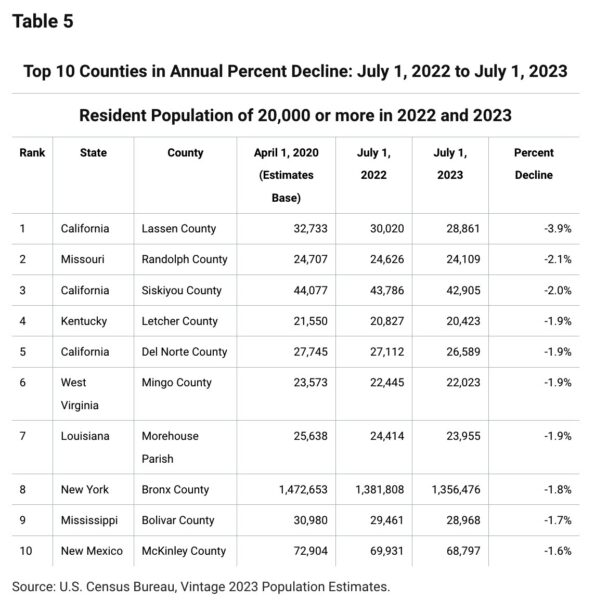
Fastest Declining
Of the counties with populations above 20,000, Lassen County, California, experienced the biggest (3.9%) decrease in 2023. Randolph County, Missouri, followed with a loss of 2.1%. Population in Bronx County, New York, continued to decline, dropping by 1.8% in 2023 after dropping 3.0% in 2022 and 2.5% in 2021.
Largest Gaining
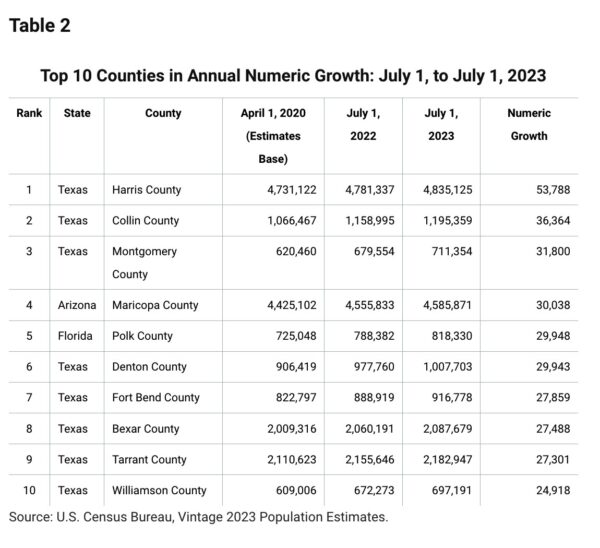
Eight of the 10 counties that led the nation by numeric change in 2023 were in Texas. This included Harris County, which added 53,788 residents and was the largest-gaining county in the nation, followed by Collin County (36,364) and Montgomery County (31,800).
Maricopa County, Arizona, the largest-gaining county in the nation in 2022, dropped to fourth in 2023 with a gain of just over 30,000 residents. Polk County, Florida, ranked fifth after adding 29,948 residents.
The remaining top five population gainers were all in Texas: Denton (29,943); Fort Bend (27,859); Bexar (27,488); Tarrant (27,301); and Williamson (24,918). Denton County gained nearly 30,000 new residents, pushing its population to just over 1 million and making it the seventh Texas county to reach this milestone.
Largest Declining
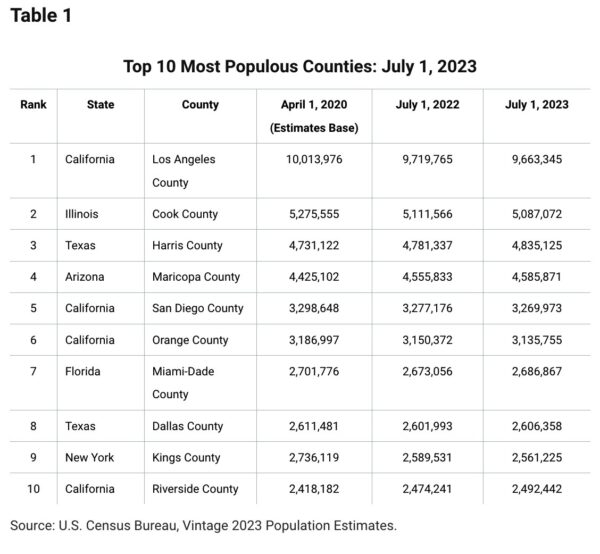
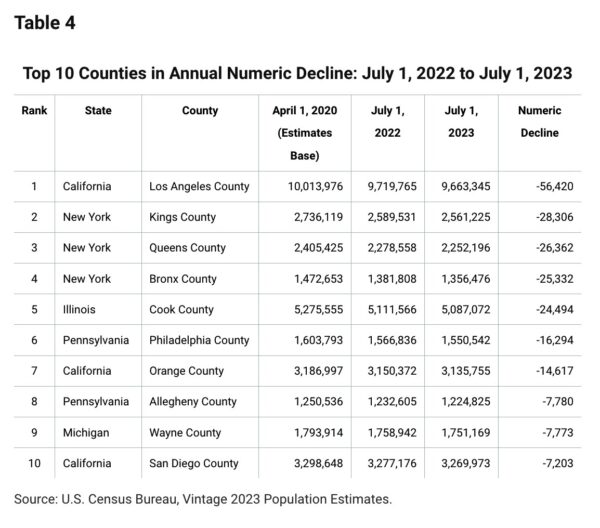
Los Angeles County, California, had the highest numeric population decline of 56,420 in 2023, compared to a loss of 89,697 people in 2022. Both drops stemmed from negative domestic migration. Kings, Queens, and Bronx counties in New York followed with population losses of 28,306; 26,362; and 25,332, respectively.
Among other large declines were Cook County, Illinois, which lost 24,494 people; Philadelphia County, Pennsylvania (-16,294); and Orange County, California (-14,617).
Refer to the bottom of the release for tables highlighting the top 10 most populous counties and top 10 counties for numeric growth and decline, as well as the fasting growing and declining.
Metropolitan and Micropolitan Statistical Areas
Approximately 73% of the nation’s 387 metro areas experienced population growth between 2022 and 2023. A smaller percentage of U.S. micro areas experienced population growth over the same period, with approximately 58% (314 out of 538) U.S. micro areas seeing gains in population.
Metro Areas
New York-Newark-Jersey City, NY-NJ (19,498,249); Los Angeles-Long Beach-Anaheim, CA (12,799,100); and Chicago-Naperville-Elgin, IL-IN (9,262,825) were the three most populous U.S. metro areas in 2023.
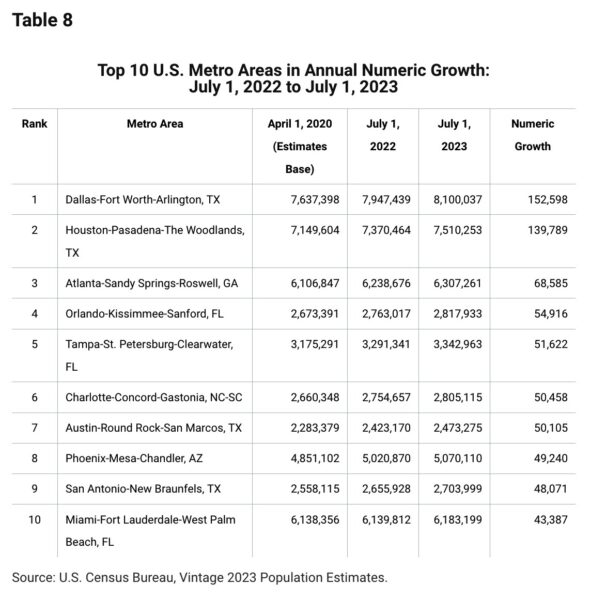
The Dallas-Fort Worth-Arlington, TX metro area surpassed 8 million residents between 2022 and 2023, adding 152,598 residents for a total population of 8,100,037. This was the largest numeric population increase of any U.S. metro area between 2022 and 2023, followed by Houston-Pasadena-The Woodlands, TX, which added 139,789 over the same period, bringing its total population to 7,510,253.
Other metro areas that experienced notable population gains between 2022 and 2023 included Atlanta-Sandy Springs-Roswell, GA (68,585); Orlando-Kissimmee-Sanford, FL (54,916); Tampa-St. Petersburg-Clearwater, FL (51,622); Charlotte-Concord-Gastonia, NC-SC (50,458); and Austin-Round Rock-San Marcos, TX (50,105).
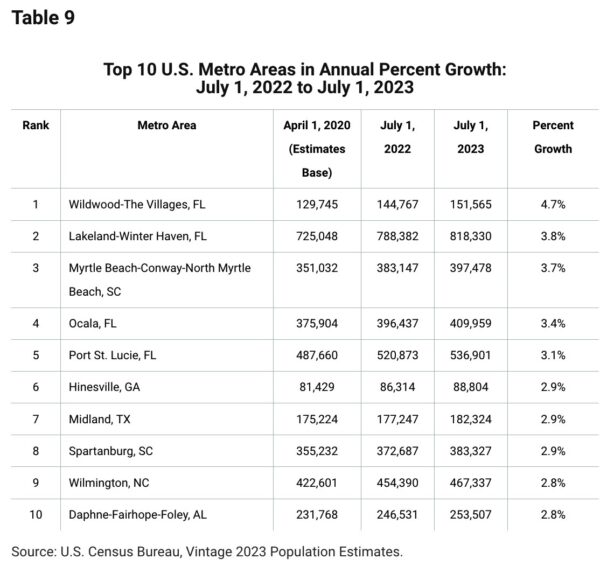
Florida had four of the five fastest-growing U.S. metro areas between 2022 and 2023: Wildwood-The Villages, FL (4.7%); Lakeland-Winter Haven, FL (3.8%); Ocala, FL (3.4%); and Port St. Lucie, FL (3.1%). Myrtle Beach-Conway-North Myrtle Beach, SC, ranked 3rd (3.7%).
Micro Areas
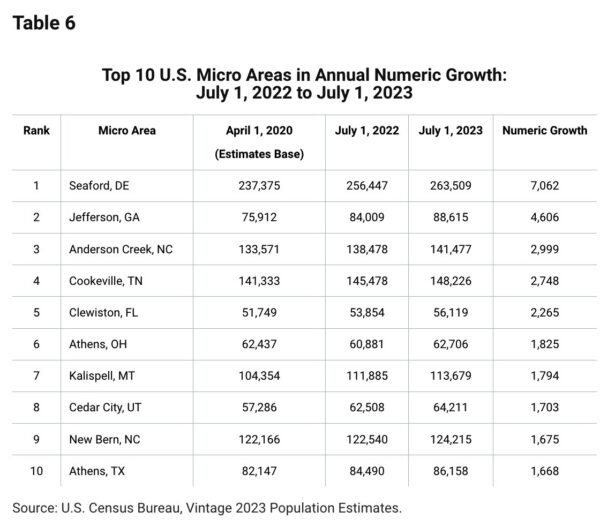
Seaford, DE, had the largest U.S. micro area gain in population, adding 7,062 between 2022 and 2023, followed by Jefferson, GA, which added 4,606 over the same period.
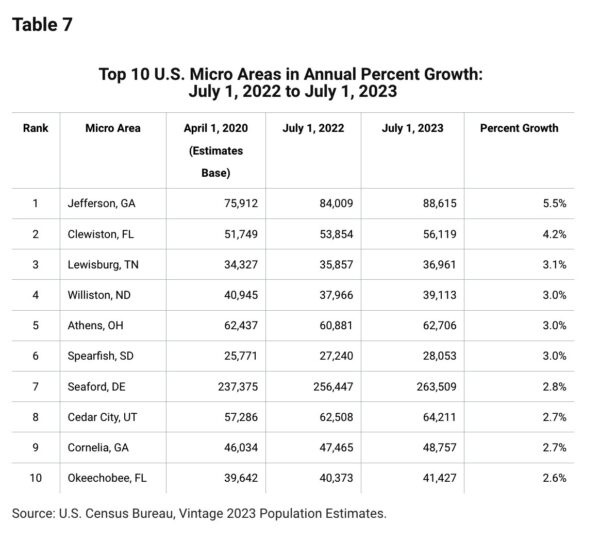
The five fastest-growing U.S. micro areas between 2022 and 2023 were Jefferson, GA (5.5%); Clewiston, FL (4.2%); Lewisburg, TN (3.1%); Williston, ND (3.0%); and Athens, OH (3.0%).
Refer to the bottom of the release for tables highlighting the top 10 metro and micro areas for numeric growth, as well as the fasting growing.
Puerto Rico Municipios
While Puerto Rico’s total population declined, 13 of its 78 municipios experienced growth in 2023; none did in 2022.
Rincón Municipio, population 15,425, was the fastest-growing and largest-gaining municipio in 2023, adding 118 people with an annual growth rate of 0.8%. It was followed by Barranquitas Municipio, which gained 101 residents (0.3%) bringing its population to 29,020.
San Juan, the most populous municipio, lost 1,582 residents – largely due to natural decrease – bringing its population down to 333,005.
Deaths outnumbered births in all municipios in 2023. Natural decrease was greatest in San Juan (1,824), followed by Bayamón (1,055) and Ponce (813).
Forty-six municipios (59.0%) had positive net migration in 2023. Guaynabo (495), Bayamón (389) and Isabela (305) had the largest net migration gains. Ponce (1,050), Toa Baja (375) and Guayama (289) had the largest net migration losses.
Technical Notes
This release includes some updates from the 2020 Census Count Question Resolution Operation (CQR) and 2020 Post-Census Group Quarters Review Program (PCGQR) which have been incorporated into the April 1, 2020, estimates base. Changes to demographic characteristics resulting from PCGQR will be incorporated into subsequent vintages of estimates. CQR errata tables with original and corrected housing and population counts are available on the 2020 Decennial Census Notes and Errata webpage. Cities and towns can expect to start seeing some 2020 PCGQR updates in the Vintage 2023 Population Estimates scheduled for release in May 2024. All updates from the 2020 PCGQR are expected to be incorporated by the Vintage 2024 Population Estimates to be released starting December 2024. The full release schedule for the Population Estimates Program can be found on the Census Bureau’s website.
In June, the Census Bureau is scheduled to release estimates of the July 1, 2023, population by age, sex, race and Hispanic origin for the nation, states, metropolitan and micropolitan statistical areas, and counties, and population by age and sex for the Commonwealth of Puerto Rico and Puerto Rico municipios. The data will be embargoed.
With each new release of annual estimates, the entire time series of estimates is revised for all years back to the date of the last census. All previously published estimates (e.g., old vintages) are superseded and archived on the FTP2 site.