Most States Had Lower Official Poverty Rates in 2019-2021 Than a Decade Earlier
February 9, 2023

Most states had lower average official poverty rates in 2019-2021 than a decade earlier, according to recent U.S. Census Bureau estimates released in January, during National Poverty in America Awareness Month.
A new historical table using the Current Population Survey Annual Social and Economic Supplement (CPS ASEC) shows that three-year average official poverty rates fell nationwide and in most states between 2009-2011 and 2019-2021.
These changes reflect economic trends over the decade.
The 2009-2011 data cover the period immediately following the Great Recession (December 2007 to June 2009), when poverty rates were among their highest this century.
The 2019-2021 data include three key time periods:
- The end of economic expansion following the Great Recession.
- The recession that accompanied the beginning of the COVID-19 pandemic (February to April 2020).
- The government’s response to the pandemic, which provided support and reduced poverty rates.
The official poverty measure uses a set of thresholds that vary by family size and composition to determine who is in poverty. Those thresholds are compared to family or individual before-tax money income. Capital gains and noncash benefits (like public housing, Medicaid or food stamps) are not included as income.
Overall, the national average official poverty rate fell from 14.8% in 2009-2011 to 11.2% in 2019-2021. The figures below demonstrate the differences between the states during both time periods.
Figure 1 shows that from 2009 to 2011:
Mississippi had among the highest average poverty rates (21.0%). It was the only state with a poverty rate of 20% or more.
New Hampshire had the lowest average poverty rate (7.3%).
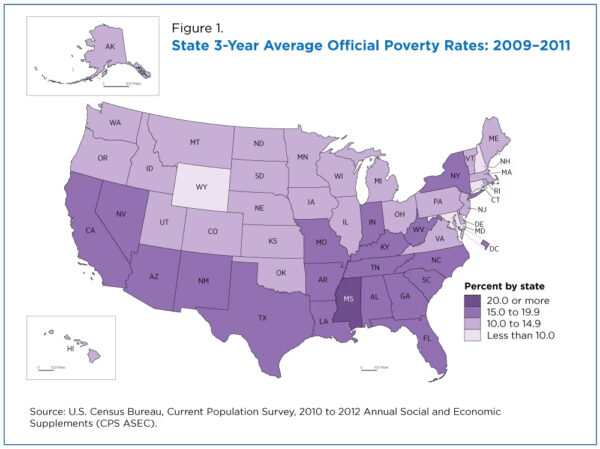
Figure 2 displays the average official poverty rate by state 10 years later, from 2019 to 2021. Among the highlights:
- Mississippi’s poverty rate fell to 18.1% but continued to be one of the highest in the country.
- New Hampshire’s poverty rate fell to 5.6%, remaining among the nation’s lowest poverty rates.
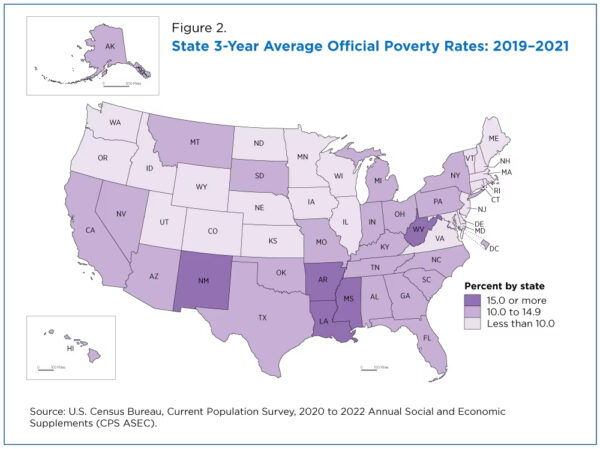
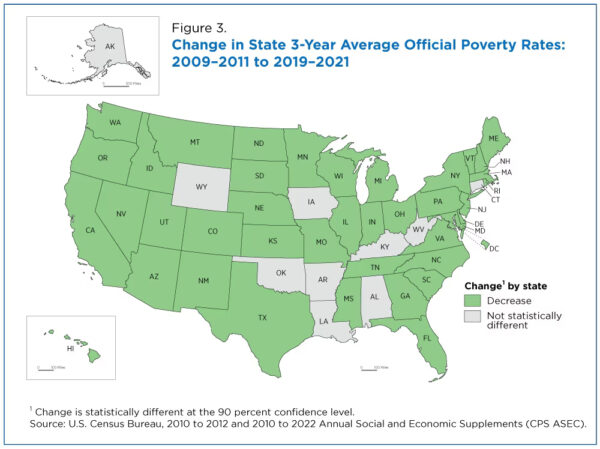
Figure 3 shows the change in the average official poverty rate between 2009-2011 and 2019-2021.
The national average poverty rate fell 3.6 percentage points between 2009-2011 and 2019-2021.
No states saw an increase in their poverty rate between periods.
Poverty rates declined in 40 states and the District of Columbia. The remaining 10 states did not experience statistically significant changes in their poverty rates.