Nearly a Third Reporting Two or More Races Were Under 18 in 2020
June 3, 2023

By Brittany Rico, Paul Jacobs and Alli Coritz
The nation’s Multiracial population was the youngest of any race group, according to recently released 2020 Census demographic data.
Among those who reported Two or More Races (referred to in this story as Multiracial) 32.5% were under age 18 in 2020 (Figure 1).
Other populations with large shares of people under 18 included: Some Other Race alone (28.6%); Native Hawaiian and Other Pacific Islander alone (28.3%); American Indian and Alaska Native alone (27.1%); and the Black or African American alone population (24.7%).
In comparison, only 19.0% of the White alone population and 20.1% of the Asian alone population were under 18.
The 2020 Census Demographic and Housing Characteristics File (DHC) provides a snapshot of the country’s race, sex and age composition.
The Multiracial population had the youngest median age (29.5) of all race groups; the most common age was 12 with more than 663,000 people this age.
This story uses the concepts of race alone and race in combination to profile the nation’s population by race and age and changes since the 2010 Census. These concepts are central to understanding our country’s changing demographics.
It is important to note that these data comparisons between the 2020 Census and 2010 Census race data should be made with caution, taking into account improvements the U.S. Census Bureau made to the Hispanic origin and race questions and the ways we code what people tell us.
How Was Race Distributed by Selected Age Categories?
Figure 1 shows that across each of the race alone groups and the Multiracial population, a higher percentage of people in 2020 were between ages 18 to 44 than any other age category. Some Other Race alone had the biggest share (43.4%).
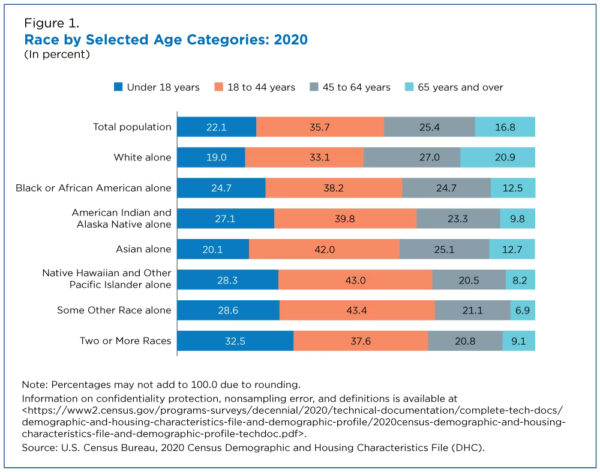
Compared to the total population, a higher proportion of older adults made up the White alone population: 27.0% were ages 45 to 64 and 20.9% were ages 65 and over.
What Racial Group Had the Highest Median Age?
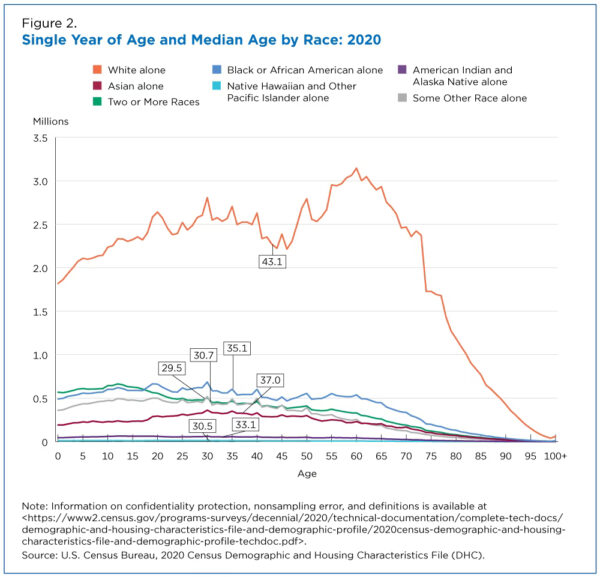
Figure 2 shows the White alone population had the oldest median age (43.1) of all race groups. The most common single year of age was 60 with over 3.1 million people that age. The most common ages were clustered from 58 to 62 for the White alone population, with each of these ages having over 3 million people.
The second and third oldest race groups in 2020 were Asian alone and Black or African American alone followed by the American Indian and Alaska Native alone, Some Other Race alone and Native Hawaiian and Other Pacific Islander alone populations (with median ages ranging from 30.5 to 37.0).
The Multiracial population had the youngest median age (29.5) of all race groups; the most common age was 12 with more than 663,000 people this age. Among the Multiracial population, the most common ages were clustered from 10 to 15, with each of these ages having over 626,000 people.
Change in Age by Race: 2010-2020
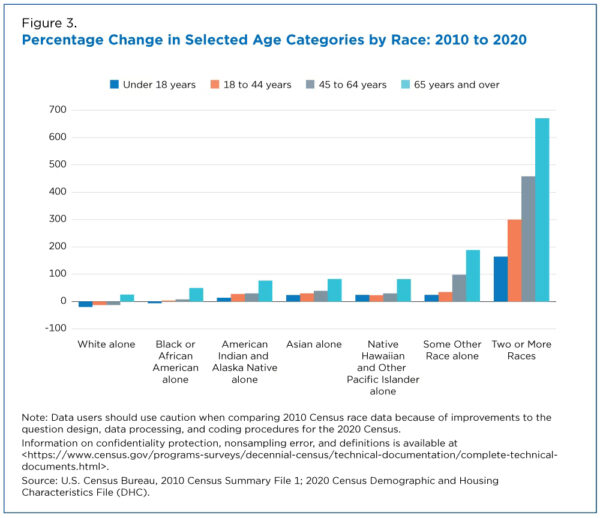
Figure 3 highlights age-specific changes for each race alone population and the Multiracial population between the 2010 and 2020 censuses.
Over the decade, some race groups saw younger populations shrink and older populations grow:
- The White alone population decreased in every age category except the 65 years and over category, which grew by more than 25% or 8,853,510 people. The White alone population under 18 decreased the most by 20% or 9,688,686 people.
- The Black or African American alone population increased in all age categories except under age 18, which decreased by more than 6%.
- All age categories grew for the American Indian and Alaska Native alone, Asian alone, Native Hawaiian and Other Pacific Islander alone, and Some Other Race alone populations. The population 65 years and over increased faster than the three younger age categories.
- The Multiracial population increased for every age category by over 164%. The 65-and-older age category had the largest percent change (670.4%), but the smallest numeric increase (2,677,912), while the 18-44 age category had the largest numeric increase (9,535,241) growing by 300%.
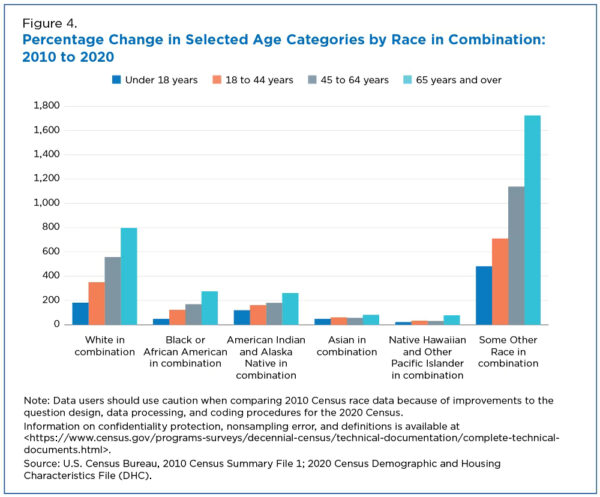
The population that reported multiple races grew faster than all race alone groups in 2020. Figure 4 shows age-specific changes for each race in combination population between the 2010 and 2020 censuses.
All race in combination groups saw growth across each age category over the decade. The Some Other Race in combination population grew the fastest – by over 482% for every age category.
Comparing 2010 to 2020
It is important to note that these data comparisons between the 2020 Census and the 2010 Census race data should be made with caution, taking into account the improvements we have made to the Hispanic origin and race questions and the ways we code what people tell us.
Accordingly, data from the 2020 Census show different but reasonable and expected distributions from the 2010 Census for the White alone population, the Some Other Race alone or in combination population, and the Multiracial population, especially for people who self-identify as both White and Some Other Race.
These results are not surprising as they align with Census Bureau expert research and corresponding findings this past decade, particularly with the results on the impacts of question format on race and ethnicity reporting from the 2015 National Content Test.


