Need to Know: What is co-viewing, and why should you care?
July 31, 2024

TV has changed dramatically in recent years. New devices, distributors, streaming platforms, subscription models, and formats are transforming the industry and empowering viewers. But there’s one thing that hasn’t changed: People love to watch TV together.
It depends on the occasion, of course—what the program is, the time of day, the size of the screen, what room it’s in, the size of the family and whether anyone simply happens to be around. But people get together today to watch the Super Bowl or The Bachelorette for the same reason they got together to watch M*A*S*H or the Apollo 11 moon landing half a century ago: to have someone to share the experience with.
In the lingo of the media industry, that’s known as co-viewing. Let’s examine why it’s so important for measurement companies to get it right.
How often do people watch TV together?
At Nielsen, we’ve been studying co-viewing for a long time. Our historic measurement solutions have always been people-based, even back when there were just a handful of major broadcast networks. So we’ve always had a reliable source of truth to size up co-viewing. Today, in homes across America, 47%1 of linear and connected TV (CTV) is consumed by more than one person at a time.
Today, there’s virtually no difference in co-viewing rates between linear TV and CTV, but it wasn’t always the case. Back in 2017, we ran a study with Roku and found a significant gap in co-viewing between linear TV (48%) and OTT (34%). Since then, smart TVs have become more widespread and large screens more affordable. And, increasingly, consumers don’t make the distinctions between linear and streaming or TV and digital. It’s all TV.
But that doesn’t mean that there aren’t any variations and that the same co-viewing factor can be applied across the board. There’s more co-viewing during primetime and on weekends, for sports and children programming, among men, young adults and in houses with more children. It also matters where the TV is located inside the house. Every case is different, and the only way to properly account for co-viewing is to measure it directly or model it separately for every ad impression.
Why care whether people are watching TV together?
Most brands want to reach people, not households—and certainly not faceless devices. Wholesale ad impressions are nice, but they’re not enough. When they buy media, advertisers and their agencies spend top dollars to reach specific demographic targets (like 18-34 year-old women in Philadelphia, or 55+ in Arizona) or advanced audiences (like EV drivers who buy organic). They need guarantees that their ads are reaching the right people, and measuring co-viewing gets to the heart of that question.
Media companies, for their part, need to know who’s watching their content to understand their audience, optimize their programming and properly price their ad inventory. If a new show performs particularly well with young adults, for instance, they can order new seasons, greenlight similar shows, and develop a niche following that they can monetize to grow their subscribers or attract advertisers eager to reach those viewers.
In today’s highly fragmented and ultra competitive TV landscape, media companies aren’t selling ‘tonnage’ anymore, and advertisers aren’t buying indiscriminate ‘eyeballs.’ They all need measurement solutions that can help them deduplicate viewers (within and across devices), calculate on-target ad delivery, optimize reach and frequency, and improve key campaign performance indicators (like target demo efficiency rates). You can’t deliver on any of those objectives without person-level measurement.
The most direct way to measure co-viewing is to monitor TV viewership at the individual level. That’s the case with our National TV Panel and top Local TV Markets. In these markets, our panelists “check-in” to the audience. But to add more depth and stability to our audience solutions—and provide more visibility into smaller audiences in smaller TV markets—we’re increasingly relying on big data based on ACR (for smart TVs) return-path data (for cable and satellite providers), or device and context identifiers (for ad impressions). And those technologies only capture viewing information at the household level.
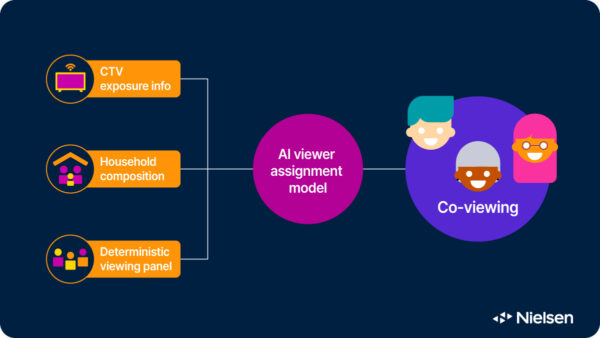
Nielsen is able to determine who is watching thanks to a process called Viewer Assignment that was developed a decade ago and has since been continuously refined. It uses advanced statistical techniques to match faceless viewing data from big data sources (like Roku, Vizio, Hulu, Netflix, YouTube and others) to our persons-level panel data for every possible viewing event and ad impression. The match is based on similarities in viewing behavior (down to the program level) as well as geography, household composition, device type and location inside the house, time of day, day of week, and other key predictors. The model never stops learning, and we’re constantly validating its performance to make sure it’s as close to reality as possible.
Having panel data on hand pays huge dividends to make the most of those new data sources, but it’s important to recognize that a process like Viewer Assignment does not compensate for all cases of missing viewer data. Sometimes, there’s no reliable match for what we see in the viewing data, or the household composition isn’t readily available. For approximately 9% of all CTV data, it remains difficult to assign even simple viewer demographics like age and gender. In these instances, Nielsen relies on robust predictive models to inform and deliver viewer assignments.