
The Perils of Perception: Americans Fail on All Measures of ‘Perceptions versus Facts’
November 6, 2014
 A new Ipsos global survey highlights how wrong the public across 14 countries are about the scale of the basic make-up of their populations– and how the United States scores against the other 13, finishing in second-to-last place.
For the unique “perceptions versus facts” test about knowledge of social-demographic aspects in their own country, Americans fail on 9 out of 9 measures. Simply put, the overall perceptions of their country on these measures versus the realities just don’t add up—and that can cause the public to be misinformed on what it surmises or advocates on various topics or issues. The closest near miss is on perceptions of voter turnout which was by just a -.9 gap.
The countries measured were Australia, Belgium, Canada, France, Germany, Great Britain, Hungary, Italy, Japan, Poland, South Korea, Spain, Sweden, and the United States.
For the 14 countries surveyed, Ipsos asked respondents to ‘guesstimate’ certain verifiable facts as a percentage or as a true/false statement, and then compared these perceptions to the reality. We then ranked a country’s accuracy by comparing these perceptions to the verified facts. The survey was carried out online using the Ipsos international respondent panel system.
The Country Accuracy Rankings: Perceptions versus Realities…
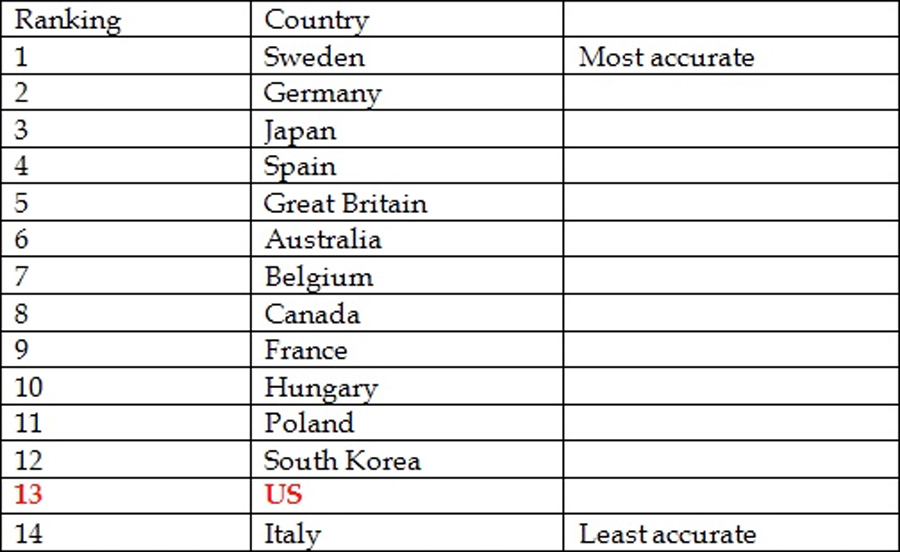
In the US we get a lot of things very wrong…
1. Ageing population: we over-estimate the US population as much older than it actually is – the average estimate is that 35.9% of the population is 65+, when it is in fact only 14%– a perception gap of -21.9 points.
2. Christians: in contrast, we underestimate the proportion of Christians – Americans think just over half (55.7%) of the country identify themselves as Christian compared with the actual figure of 78%%–a perception gap of -22.3 points.
3. Muslims: we hugely over-estimate the proportion of Muslims in the US – we think one in seven (15%) of people are Muslims when the actual figure is 1%–a perception gap of -14.4 points.
4. Unemployment: Americans over-estimate that nearly 32.1% of the working age population is unemployed when the actual figure is much lower at 6%– a perception gap of -26.1 points.
5. Murder rate: Americans are dead wrong on their murder rate with 51% saying it is rising (which is incorrect) whereas only 30% think it is falling (which is correct) and 18% say they don’t know—a perception gap of -21 points.
6. Teenage pregnancy: Americans over-estimate that one quarter (23.9%) of all teenage girls aged 15-19 give birth each year, when the actual figure is only 3.1%– a perception gap of -20.8 points.
7. Immigration: Americans over-estimate that 32.3% of the population are immigrants while the real figure is 13%– a perception gap of -19.3 points.
8. Voting: Americans just underestimate the proportion of the electorate that voted in the last general election – the average guess is 57.1% when the official turnout was a paper thin higher at 58%– a perception gap of .9 points.
9. Life expectancy: Americans underestimate our life expectancy thinking the average for a child born in 2014 will be 78.1 years, when the actual estimate is 80 years— a perception gap of -1.9 points.
But the rest of the world gets it wrong too…
1. Teenage birth rates: on average, people across the 14 countries think that 15% of teenagers aged 15-19 give birth each year. This is 12 times higher than the average official estimate of 1.2% across these countries. But other countries with very low rates of teenage births are further out proportionally: for example, Germans think that 14% of teenage girls give birth each year when it’s actually only 0.4% (35x the actual figure).
2. Muslims: people across just about all countries hugely overestimate the proportion of their population that are Muslim: the average guess across the countries is 16% when the actual proportion is 3%. For example, on average people in France think 31% of the population is Muslim, when the actual figure is only 8%. In Australia the average guess is nine times the actual proportion: people estimate it at 18%, when the actual proportion is only 2%.
3. Christians: in contrast, majority-Christian countries tend to underestimate how many people count themselves as Christian. In the 12 majority-Christian countries in the survey, the average guess is 51%, when the actual proportion counting themselves as Christians is 61%. This includes countries like the US where people think 56% are Christian when official data shows it is 78%.
4. Immigration: across the 14 countries, the public think immigration is over twice the actual level – the average guess is that 24% of the population was born abroad, when the actual figure is 11%. This includes some massive overestimates: the US public think 32% of the population are immigrants when the actual is 13%; in Italy the public think 30% are immigrants when it’s actually 7%; and in Belgium the public think it’s 29% when it’s actually 10%.
5. Ageing population: we think the population is much older than it actually is – the average estimate is that 39% of the population is 65+, when only 18% are. Italians are particularly wrong on this – on average, they think nearly half the population (48%) are 65+, when it is actually 21%.
6. Voting: every country in the study underestimates the proportion of the electorate who voted in their last major election. The average guess is that 58% voted, when in fact 72% did. The French in particular are too pessimistic about the extent of democratic engagement: estimating that only 57% of the electorate voted in the Presidential election, when in fact 80% did.
7. Unemployment: people tend to greatly overestimate the extent of unemployment in their countries. The average guess is 30%, when the actual figure is 9%. This includes some huge overestimates, for example in Italy, where the average guess is that 49% are unemployed, compared with an actual rate of 12%.
8. Life expectancy: this is one area where on average we have a much better grasp of reality. Across the 14 countries, the average life expectancy for a child born this year is estimated to be 80 years, when across these countries as a whole it’s actually 81 years. However, there is still a wide range between countries: people in South Korea are too optimistic, expecting the average life expectancy to be 89 years, compared with an actual of 80 years; but Hungarians are too pessimistic, only expecting 68 years, when the average is predicted to be 75 years.
9. Murder rates: 49% of people across the countries think that the murder rate is rising and only 27% think it is falling – when in fact in all countries in the study, the murder rate is actually falling. The British are the most likely to have an accurate view of murder rate trends: 49% think it’s falling and only 25% think it’s rising.


