
Share of U.S. Coupled Households Declined in 2020
May 30, 2023

By Rose M. Kreider, Lydia Anderson, Thomas Gryn and Chanell Washington
Coupled households are still the most common type of households but their share declined to 53.2% in 2020, down from 55.1% in 2010 and 56.9% in 2000.
Coupled households are when the householder has a spouse or partner living with them.
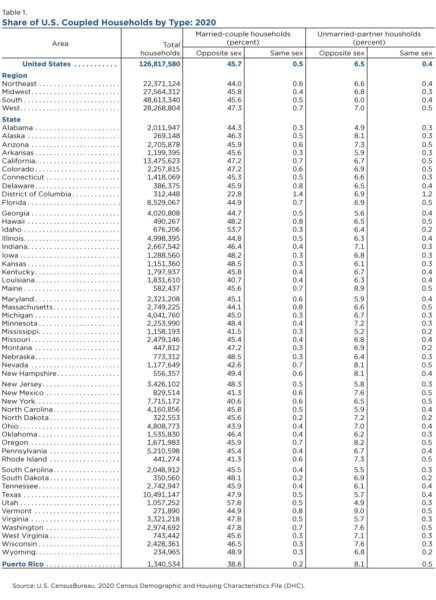
The majority of these households were opposite-sex married (45.7%) couples, followed by opposite-sex unmarried (6.5%), same-sex married (0.5%) and same-sex unmarried (0.4%).
The 2020 Census demographic characteristics data released today shows that the highest percentage of coupled households of all types were in the West (47.3% of households were opposite-sex married, 0.7% same-sex married, 7.0% opposite-sex unmarried, and 0.5% same-sex unmarried).
The states with the highest concentrations of same-sex married couples were along the West Coast of the United States, in the Northeast, plus Delaware, the District of Columbia, Florida, Hawaii and New Mexico.
At the other end of the spectrum, the Northeast had the lowest share of opposite-sex married couple households at 44.0%, while the South had the lowest share of opposite-sex unmarried couple households at 6.0%. The Midwest had the lowest percentage of both same-sex married (0.4%) and same-sex unmarried (0.3%) coupled households.
Share of Opposite-Sex Married Couple Households Highest in Utah
- Utah had the biggest share (57.8%) of opposite-sex married couple households, and the District of Columbia had the smallest (22.8%).
- Vermont had one of the highest percentages (9.0%) of opposite-sex unmarried couple households, and Alabama and Utah had the lowest (4.9%).
- District of Columbia Had Highest Share of Same-Sex Married Couple Households
- The District of Columbia had the largest share of same-sex married couple households (1.4%), and North Dakota, South Dakota and Puerto Rico had the smallest (0.2%).
- The District of Columbia also had the highest percentage of same-sex unmarried households (1.2%) of all households, while Idaho, Mississippi, Montana, North Dakota, South Dakota and Wyoming had the lowest (0.2%).
Majority of Coupled Households Are Opposite-Sex Married But Varies by State
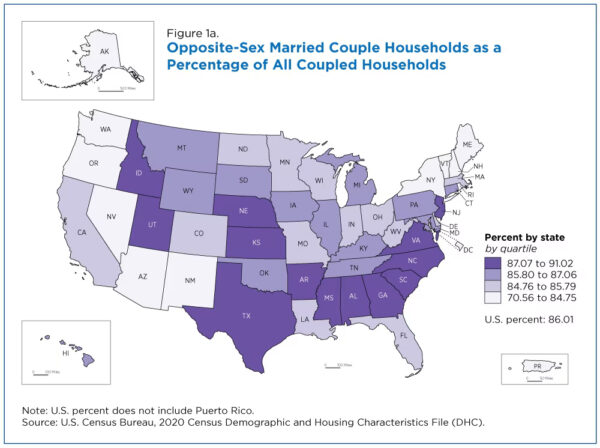
While Table 1 shows opposite-sex and same-sex married and unmarried couples as a percentage of all households, Figures 1a-d map each category as a percentage of coupled households.
In 2020, opposite-sex married couples made up 86% of coupled households. Figure 1a shows the highest percentages of opposite-sex married couples were concentrated in the southern U.S. states.
States in other regions with big shares of opposite-sex married couples included Idaho, Kansas, Nebraska, New Jersey and Utah. Those with the smallest shares: Arizona, New Mexico, and Nevada and states in the Northeast and the Pacific Northwest.
Opposite-sex unmarried couples showed an almost inverse pattern (Figure 1b).
States in the South, Idaho, Kansas, New Jersey and Utah had the lowest percentages of opposite-sex unmarried couples; while states in the Northeast, Oregon, New Mexico and Nevada were among those with the highest percentages.

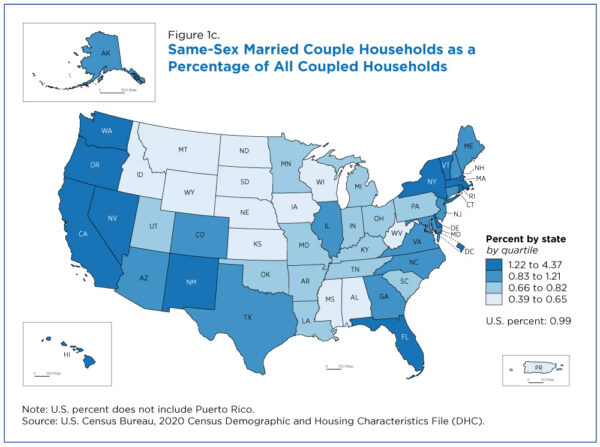
Same-Sex Couples Make Up 1.7% of Coupled Households
The states with the highest concentrations of same-sex married couples were along the West Coast of the United States, in the Northeast, plus Delaware, the District of Columbia, Florida, Hawaii and New Mexico (Figure 1c).
Several states with relatively low percentages of same-sex couples were concentrated in the West North Central Midwest, including Iowa, Kansas, Nebraska, North Dakota and South Dakota. Idaho, Montana and Wyoming in the West also had relatively low percentages of same-sex couples.
Unlike the inverse pattern seen for opposite-sex married and unmarried couples, the geographic pattern for same-sex unmarried couples mirrored that of same-sex married couples.
The West Coast and Northeast again contained some of the states with the highest percentages of same-sex unmarried couples, along with the Southwest, District of Columbia, Florida, Hawaii and Puerto Rico (Figure 1d).
Similar to same-sex married couples, states in the West North Central Midwest were among those with the lowest percentage of same-sex unmarried couples.

Improved Measures of Coupled Households
The U.S. Census Bureau revised the relationship to householder question in the 2020 Census to improve the quality of coupled-household data after discovering issues with the measurement of coupled households in the 2010 Census.
After more than a decade of research and an Office of Management and Budget (OMB)-led interagency working group, the Census Bureau implemented improvements in three areas to address data quality:
- Added specific answer categories for: opposite-sex spouse, opposite-sex unmarried partner, same-sex spouse, same-sex unmarried partner.
- Created an automated check for consistency between the reports of sex and relationship in electronic questionnaires.
- Updated how the data were processed when reported sex values for the couple did not align with their reported relationship category. For example, a respondent might report John as male and Mary as his opposite-sex spouse, but mistakenly report Mary as male.
Prior to these changes, researchers found that the sex of a small portion of people in opposite-sex coupled relationships was misreported (as identified by an evaluation of their first name). This resulted in some couples being misclassified as same-sex couples.
However, because same-sex couple households are a much smaller proportion of all coupled households than opposite-sex couples, this small amount of reporting error affected overall estimates of same-sex couple households. These changes were implemented to address these inconsistencies and improve estimates of same-sex couple households.
The Census Bureau first used the revised question in the 2014 Survey of Income and Program Participation (SIPP), 2019 American Community Survey (ACS), and 2019 Annual Social and Economic Supplement to the Current Population Survey (CPS ASEC).
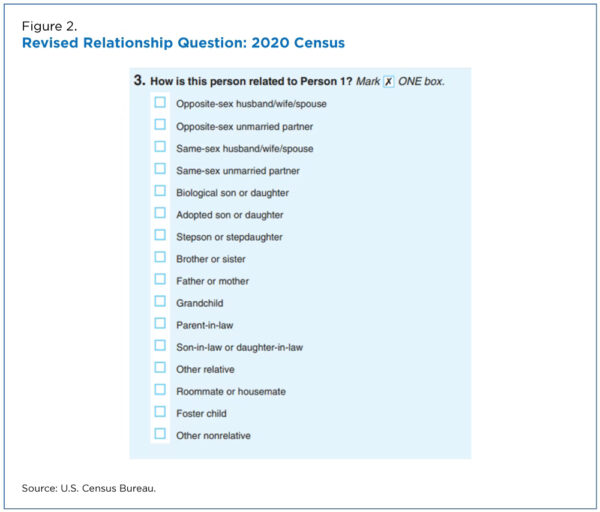
There were two other differences between the answer categories in 2010 and 2020 (Figure 2):
The category for “roomer/boarder” was dropped in 2020 because it overlapped with “roommate or housemate” and “other nonrelative” categories. (The category for “roommate or housemate” was retained since it is a commonly used term.)
The 2020 Census restored the “foster child” category, which had been dropped in 2010.
While there were shifts in categories, some comparisons to 2010 Census data can be made while keeping these changes in mind. Comparison guidance is available in the 2020 Census Demographic and Housing Characteristics File (DHC) Technical Documentation.
About Authors
Rose M. Kreider, Lydia Anderson, Thomas Gryn, and Chanell Washington are family demographers in the Fertility and Family Statistics Branch of the Social, Economic, and Housing Statistics Division.


