Super Bowl scores with $2.9B in ad spend
January 22, 2015
![]() Among sports fans, the escalating interest around Super Bowl XLIX is focused on which team will earn the championship trophy for its on-field performance. Among marketing and advertising professionals, the chatter is centered on the TV commercials that will air during the game and the integrated multimillion-dollar marketing campaigns from these sponsors. Who will score or fumble on advertising’s biggest day of the year?
Among sports fans, the escalating interest around Super Bowl XLIX is focused on which team will earn the championship trophy for its on-field performance. Among marketing and advertising professionals, the chatter is centered on the TV commercials that will air during the game and the integrated multimillion-dollar marketing campaigns from these sponsors. Who will score or fumble on advertising’s biggest day of the year?
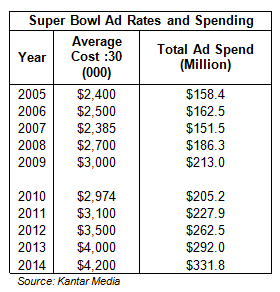
Kantar Media has mined its extensive database to report on the past ten years of Super Bowl advertising. From 2005 through 2014, the Super Bowl game has generated $2.19 billion of network advertising sales from more than 130 marketers, making it one of the most valuable sports franchises in the US. With ad rates and revenues continuing to rise, the Super Bowl remains a winning game.
The Price of Advertising
The average rate for a 30-second advertisement in the Super Bowl game has increased by 75 percent during the past decade and reached $4.2 million in 2014. It’s the most expensive commercial time on television by far. (The 2014 runner up: the NFC Championship Game at $1.95 million per :30). Healthy demand is expected to result in higher pricing for the 2015 game.
The actual amount paid by individual marketers will vary depending on where the ad runs in the game, how much commercial time is purchased and whether the advertiser opts for a larger package that includes spots in the pre-game and/or post-game coverage.
More Advertising, More Clutter
Even as Super Bowl ad pricing has increased, the volume of commercial time in the game has also been expanding. The past five Super Bowls have been the most ad-saturated in history, each containing more than 47 minutes of commercial time. This includes paying sponsors, commercial messages from the NFL and promotional announcements from the network for its own shows.
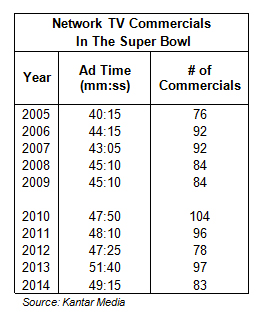
The spike in ad time for the 2013 “Blackout Bowl” was partly due to a decision by CBS to re-run a commercial pod that first aired just after the game was halted by a stadium power outage. CBS was unsure whether its broadcast signal survived the blackout and as a precaution for the affected advertisers it re-aired their commercials later in the game.
Longer Length Commercials
Despite the high cost of air time in the Super Bowl, a significant proportion of advertisers opt to spend even more by running longer length commercials. It’s an effort to tell a deeper story and further engage viewers. Forty percent of the paid ads in the 2014 game were 60 seconds or longer, the highest share since at least 1984.
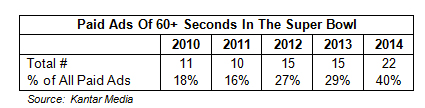
By comparison, the normal proportion of long-form ads on broadcast networks is about six percent.
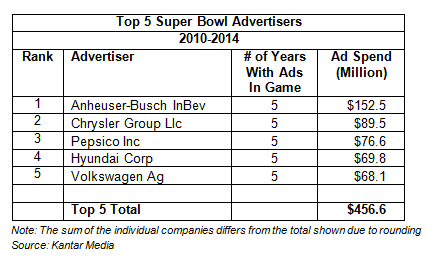
Top Five Super Bowl Advertisers
During the past five years the top five Super Bowl advertisers have spent $456.6. million on network advertising during the game, accounting for 35 percent of total advertising revenue. Anheuser-Busch InBev and Chrysler lead the pack, followed by Pepsico, Hyundai, and Volkswagen.
Local Market TV Sponsors: The Second Battleground
Most interest is focused on the national TV commercials appearing in the Super Bowl. However, affiliate stations in local markets also have an allotment of air time to sell and this inventory offers another way for sponsors to access the event, albeit on a smaller scale.
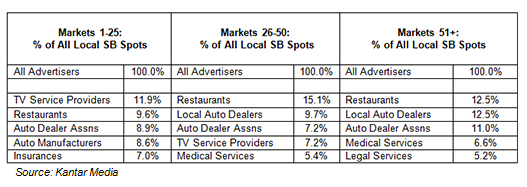
What categories of advertisers typically appear on the local market broadcasts? There are some variations between larger and smaller population markets. In the 2014 game, restaurants and auto dealer associations were prevalent in markets of all size. In top 25 markets, TV Service Providers (particularly Comcast and Time Warner Cable), auto manufacturers and insurance marketers were also mainstays.
Outside the Top 25 markets, where the price of ad time diminishes, a more eclectic and localized group of advertisers stepped forward including local auto dealerships, medical services and legal services.
Each year there are some noteworthy strategies on display in the Super Bowl from local advertisers. In the 2014 game one of these advertisers was the Church of Scientology. For the second year in a row the religious movement promoted its philosophy in a 30 second unit that cleared in 17 markets, including several containing Scientology’s major centers.
Another was Alex and Ani, the manufacturer and retailer of fine jewelry. Taking advantage of the Super Bowl’s proximity to Valentine’s Day, Alex and Ani ran spots in 19 select markets to provide marketing support for its network of company-owned stores.
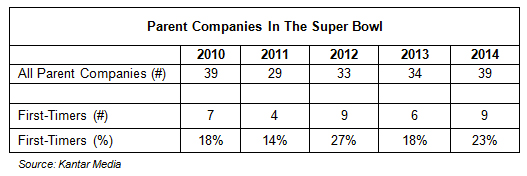
First Time Advertisers
In recent years, there has been a steady influx of first-time advertisers eager for the recognition and brand-building opportunity of the Super Bowl spotlight. In 2014 first-time advertisers accounted for 23 percent of the Super Bowl ad lineup.
A sizable rookie class is expected in 2015. NBC says it has sold time to 15 first-time participants, including Carnival, Loctite, Mophie, and Wix.
It’s not clear whether NBC’s count is based on brands or the parent company owners of brands. A first-time brand in the Super Bowl may be from a company that has previously purchased spots. Kantar Media counts in the table below are based on parent companies.
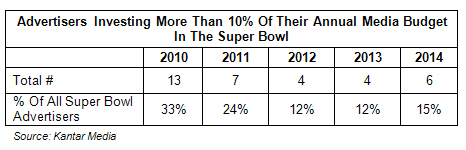
Small Players on a Big Stage
The daunting price of Super Bowl ad time would seem to be a barrier to small marketers with limited budgets. However, each year the roster of Super Bowl advertisers includes several companies who invest a hefty chunk of their annual budget to buy commercial time. In 2014, six Super Bowl advertisers put more than 10 percent of their full-year media budgets into the game.
The most leveraged sponsor in the 2014 Super Bowl was Soda Stream International. Its $4.2 million ad buy represented 39 percent of its full year measured ad expenditures. Sonos was second at 25 percent.
Top Super Bowl Advertising Categories
Over the past decade, the Super Bowl has attracted a bevy of different automotive, movie studio and dot-com companies, making these the most populous and competitive ad categories.
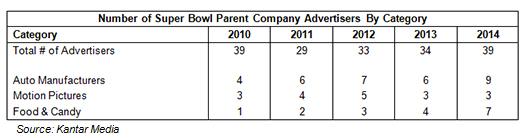
The Food & Candy category (which excludes all beverage brands) had a stout presence in the Super Bowl in the late 90s before tailing off, and has now been resurgent. While Doritos snack food has been a perennial sponsor, a growing number of candy, yogurt and specialty food brands have purchased time in recent years.
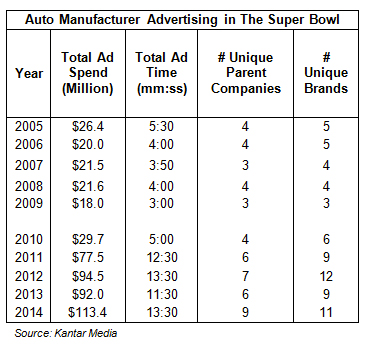
Traffic Congestion: Auto Advertising
The 2014 Super Bowl was the fourth consecutive year with a glut of automotive ads. A whopping $113 million was spent by eleven different nameplates and the category accounted for over one-fourth of total ad time in the game. Automakers will have a smaller footprint in the 2015 game. Based on corporate announcements thus far, at least two brands (Jaguar and Volkswagen) will not be returning.
The Media Value Of On-Screen Sponsor Exposure
Paid commercials airing during breaks in the game are the most common means for marketers to reach Super Bowl TV viewers. However, there are two additional on-screen exposure opportunities that provide high value for specific sponsors: (1) the venue sponsor; and, (2) the halftime show sponsor.
Kantar Media projects that venue sponsor University of Phoenix will receive about $11.2 million in Sponsorship Media Value from the Super Bowl. This is based on an average 6 minutes, 20 seconds of exposure during the in-game broadcast, primarily from TV camera shots of the stadium. Sponsorship Media Value, a proprietary calculation developed by Kantar Media, takes into account duration, source and prominence of the sponsor’s on-screen exposure
For halftime Super Bowl sponsor Pepsi, the expected exposure time based on historical averages is 4 minutes, 10 seconds which would equate to about $7.3 million of Sponsorship Media Value. Exposure for the halftime sponsor is through on-screen billboards appearing during the first and second quarter of the game, verbal mentions from the announcers and stage signage during the performance itself.
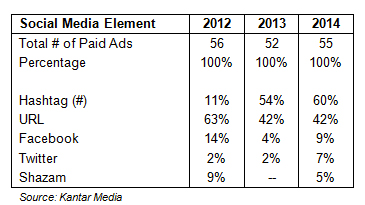
The Social Super Bowl
The Super Bowl generates plenty of second-screen activity during the game and marketers have accelerated their efforts to attract and engage multi-platform consumers. It’s evidenced by the increased number of ads containing a social media element.
According to Kantar Media’s analysis of paid commercials shown during the game, hashtags have overtaken URLs as the most popular call to action mechanism. Last year 60 percent of paid ads (33 of 55) contained a hashtag as compared to 54 percent in 2013.
According to Twitter, more than 24.9 million tweets about the football game and halftime show were sent. By comparison, there were about 583,000 tweets relating to ads appearing during the game. This figure does not include the Twitter conversation for a post-game ad aired by Esurance where the company offered a $1.5 million giveaway to a lucky viewer who tweeted a specified hashtag. Esurance has said the contest generated a total of 5.4 million hashtag uses.
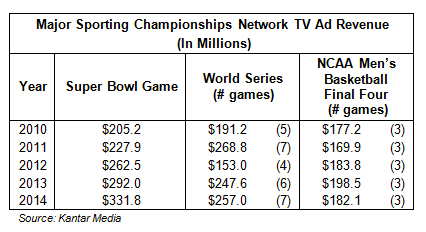
How Large Is The Super Bowl Versus Other Sport Franchises?
Major League Baseball’s World Series and the NCAA Men’s Basketball Championship are two other high profile sporting events that attract significant interest from TV advertisers. But how do these compare to the Super Bowl in terms of ad spend?
The World Series is comprised of four to seven games. March Madness peaks with the semi-finals and championship on its final weekend, a total of three games. The Super Bowl, of course, is a single telecast and in recent years it has been pulling away from March Madness and the Fall Classic.