
U.S. Advertising Expenditures Increased 3.5% in the Second Quarter Of 2013
September 10, 2013
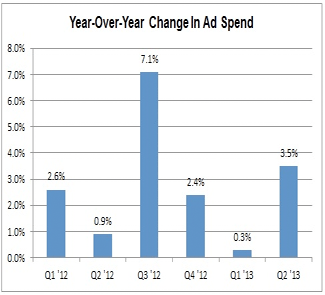
![]() Total advertising expenditures in the second quarter of 2013 increased 3.5 percent from a year ago and finished the period at $35.8 billion, according to data released today by Kantar Media, the leading provider of strategic advertising and marketing information. Total spending for the first six months of the year grew 2.0 percent to $68.9 billion.
Total advertising expenditures in the second quarter of 2013 increased 3.5 percent from a year ago and finished the period at $35.8 billion, according to data released today by Kantar Media, the leading provider of strategic advertising and marketing information. Total spending for the first six months of the year grew 2.0 percent to $68.9 billion.
“Ad spend has now increased for six consecutive quarters and in reaching 3.5 percent growth for Q2, had its best performance in a non-Olympic period since the end of 2010,” said Jon Swallen, Chief Research Officer at Kantar Media North America. “However, the gain was boosted by two unusual phenomena. On one side, year ago spending was deflated by major advertisers who conserved budgets in advance of the Summer Olympics and this makes current year growth appear larger. On the other side, there were more NBA playoff games this year and it generated a sizable windfall of extra TV ad revenue. Without these factors, Q2 ad spend growth would have been lower by about one full percentage point.”
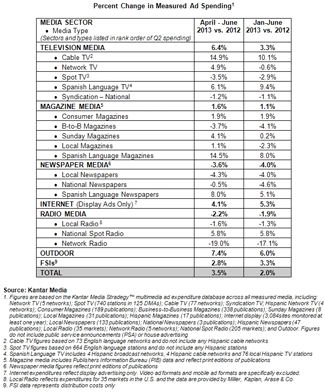
Measured Ad Spending By Media
Television media continued to headline the ad market in the second quarter of 2013 with overall growth of 6.4 percent, thanks in part to post-season basketball games. Cable TV spending jumped 14.9 percent due in part to a larger number of NBA playoff telecasts as well as higher primetime ad prices at leading networks. Network TV expenditures rose 4.9 percent, with comparisons helped by the extra revenue from a seven game NBA championship series (versus five games in 2012). An additional benefit came from a timing shift that moved ad money for NCAA Final Four basketball games out of March and into April.
Spanish Language TV spending increased 6.1 percent in the second quarter on higher budgets from direct response marketers, auto manufacturers and restaurants. Hispanic networks continue to see stronger results than local market Hispanic stations.
Spot TV expenditures declined 3.5 percent in the period. The reduced volume of political ad spending that regularly occurs in odd-numbered years is becoming more of a drag for local stations as the year progresses. Excluding the political category, Spot TV ad spending in Q2 was level versus a year ago.
Outdoor media expenditures were up 7.4 percent in the second quarter, the thirteenth consecutive quarter of year-over-year increases, and were spurred by healthy gains from its core categories of restaurants, local retail and local service businesses. Outdoor media also continues to see gains due to the expansion of new digital formats.
Internet Display advertising increased 4.1 percent during the period. Spending totals, which do not include either video or mobile ad formats, got a significant lift from both financial service and telecom advertisers. Investments by travel and tourism advertisers also increased leading into the key summer vacation season.
Consumer Magazines registered an expenditure increase of 1.9 percent as calculated by rate card prices but this was tempered by a 2.1 reduction in the number of ad pages sold. Sunday Magazines had a similar pattern with expenditures up 4.1 percent but ad pages down 6.3 percent.
Newspaper media continued to lose ground in the quarter. Local Newspaper ad spending declined 4.3 percent on weakening budgets from auto dealers, financial services and retailers. National Newspapers were down 0.5 percent.(Both Consumer Magazines and Newspaper media spend figures are based on print editions only.)
Radio experienced mixed results. Spending in National Spot Radio rose 5.8 percent with strong demand from telecom, restaurants and retail segments. Local Radio fared less well as quarterly expenditures dropped 1.6 percent.
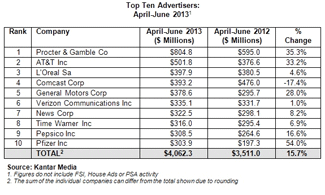
Measured Ad Spending By Advertiser
Spending among the ten largest advertisers in the second quarter of 2013 was $4,062.3 million, a 15.7 percent increase compared to a year ago. Among the Top 100 marketers, a diversified group accounting for more than two-fifths of all measured ad expenditures, budgets rose 10.0 percent.
Procter & Gamble was the top-ranked advertiser in the period; its measured spending surged 35.3 percent to $804.8 million. Large increases were also posted by AT&T (up 33.2 percent, to $501.8 million) and General Motors (up 28.0 percent, to $378.6 million). Growth rates were artificially boosted for all three marketers because spending rates in the year ago period were below normal, as the companies moved budgets into July and August to fund costly Summer Olympics sponsorships. Because of this timing phenomenon, P&G, AT&T and GM are less reliable as a benchmark when analyzing the Q2 2013 ad marketplace.
The largest rate of increase among the Top Ten advertisers came from Pfizer, which raised expenditures 54.0 percent to $303.9 million. The catalyst was the consumer marketing launch of two new prescription drugs.
L’Oreal spending reached $397.9 million in the quarter, up 4.6 percent, as it directed more support to the Lancome cosmetics line. Pepsico entered the Top Ten rankings by spending $308.5 million, a 16.6 percent increase. The company ramped up media investments for core brands including Gatorade, Pepsi and Quaker.
Media conglomerates claimed several spots on the Top Ten list. News Corp. spent $322.5 million, up 8.2 percent. Time Warner raised its expenditures 6.9 percent to $316.0 million. Comcast investments were down 17.4 percent to $393.2 million. For each of these advertisers results were primarily shaped by their movie studio divisions and the number of films in theater release.
Measured Ad Spending By Category
Expenditures for the ten largest categories grew 4.1 percent in the second quarter of 2013 to $22,090.7 million.
Retail was the top category with expenditures of $3,823.5 million in the period, up a negligible 0.1 percent versus a year ago. Higher spending by department store brands and home furnishing stores was offset by reductions among food, pharmacy and clothing retailers.
Automotive was the second largest category by dollar volume, with media spending of $3,633.0 million, a 6.9 percent increase. Manufacturer investments rose 8.2 percent while dealers spent 5.0 percent more. Auto ad spending continues to be pushed higher by a combination of the strong sales climate for new vehicle and a steady stream of marketing launches for new and redesigned models.
Telecom ad expenditures increased 19.5 percent, to $2,361.0 million. The wireless segment was quite active as Sprint and T-Mobile each lifted spending to try and reverse subscriber losses. Higher budgets from leading wireless handset manufacturers and TV service providers also contributed to category growth.
Second quarter expenditures for Restaurants were up 12.6 percent to $1,732.6 million. With customer traffic to quick service and casual dining restaurants still sluggish, more brands are hiking ad budgets in an effort to gain, or at least retain, market share versus rivals.
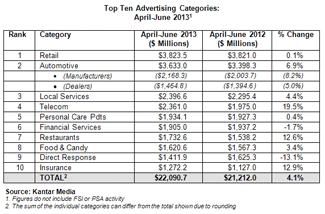
Insurance category ad spending rose12.9 percent to $1,272.2 million as major auto insurers expanded their marketing programs. Modest gains were recorded by Food & Candy (up 3.4 percent to $1,620.6 million) and Personal Care Products (up 0.4 percent to $1,934.1 million).
COURTESY OF KantarMediaNA.com


